
Hi Traders! Today we are going to see about how to trade with price action only. In this strategy we rely only on the charts, pure price, without any indicators, to find the best setups and the best trading opportunities. In this article I will explain you the basics of –
- Advantage of trading “naked” charts
- How to define trend?
- Multi-timeframe trading advantage
- Turning principles
- Charts Only Trading Strategy – Important Notes
(Note: Personally I love indicators especially MACD and Bollinger Bands because in my POV they are amazing tools but for beginners I would suggest to learn to trade naked charts or at least practice for a long term with naked charts. Because when you are dealing with naked charts all you focus on is the price like how the price changes? What makes the price to move in a specific direction? So when you learn this, the second part to work with indicators would be much easier. Those who start to rely on indicators from the first day basically ignores the price, charts, levels and movements).
Advantage Of Trading “Naked” Charts
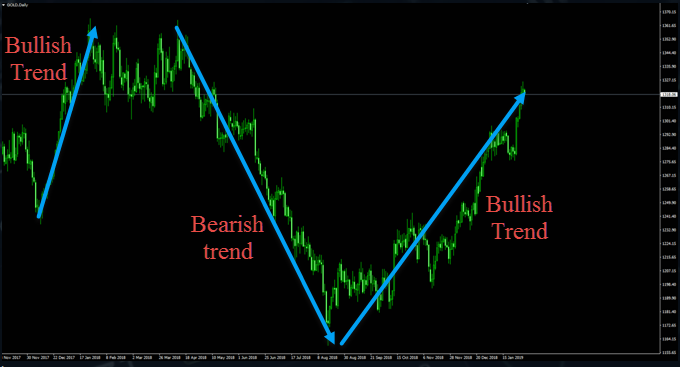
The advantage of using naked charts is that we can see clear trends. An example of naked chart with clear trends is shown below:
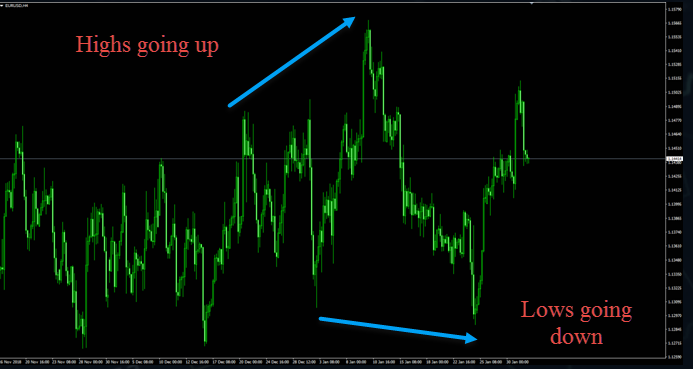
With naked charts we can easily identify whether we have trends or not. For example if we take a look at the below chart we can see that there is nothing clean and clear to trade. The highs are going up and the lows are going down.
So that’s the advantage of looking at a naked chart. When you look at the indicators first, each indicator will tell you something different (some will indicate us to buy at a certain level and at the same level some other indicator will indicate us to sell). Each indicator has a specific mathematical condition and each indicator can be used in specific market conditions (like trend trading, range trading, reversals, trade continuation, etc…) This is why when you learn to identify price you will be able to understand the basics and this is what you need to make good decisions.
How To Define Trend?
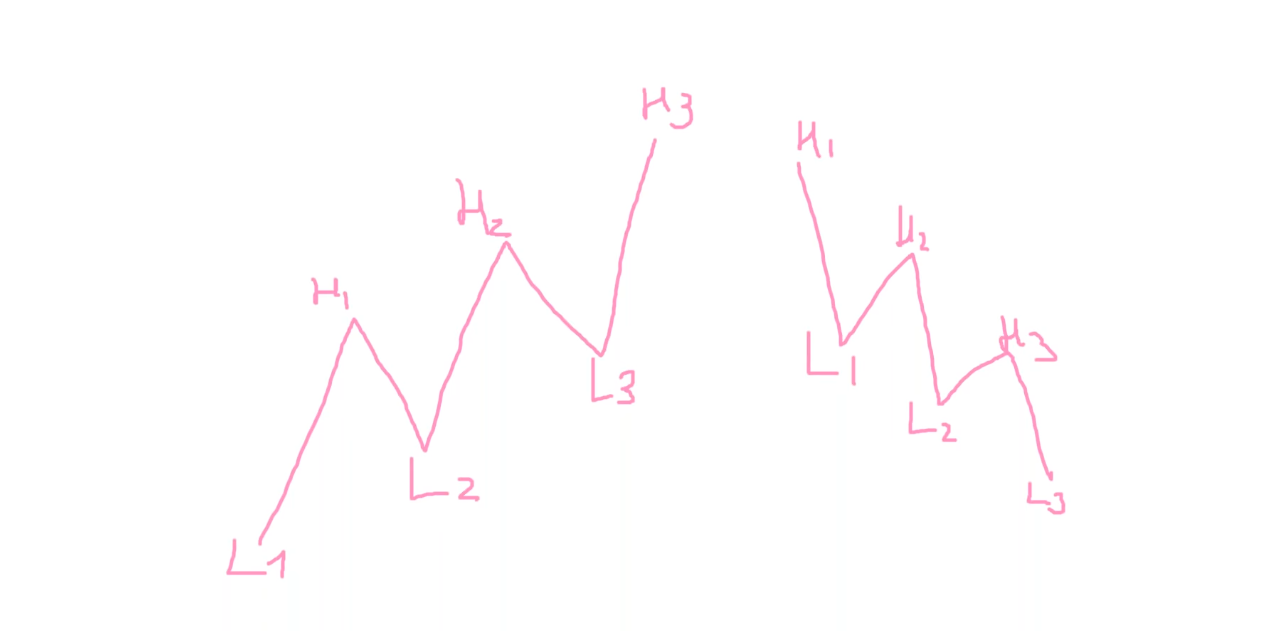
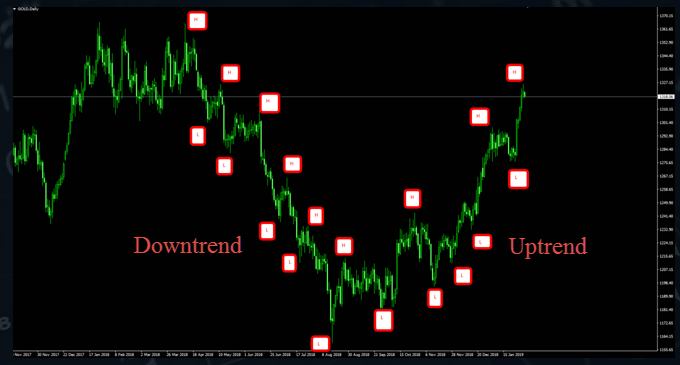
The uptrend is defined when you have the highs and lows going up and each high and low is higher than the previous one. Whereas the downtrend is just the opposite where the highs and lows are going down and each high and low is lower than the previous one, as shown in the image below.
When we have at least 3 highs and 2 lows going down, we can call it as a downtrend (bearish trend). When we have 3 lows and 2 highs going up and anything above that would make it an uptrend (bullish trend).
The higher the timeframes, the higher the trend will be and the lower the timeframes, the lower the trend will basically represent.
Multi-timeframe Trading Advantage
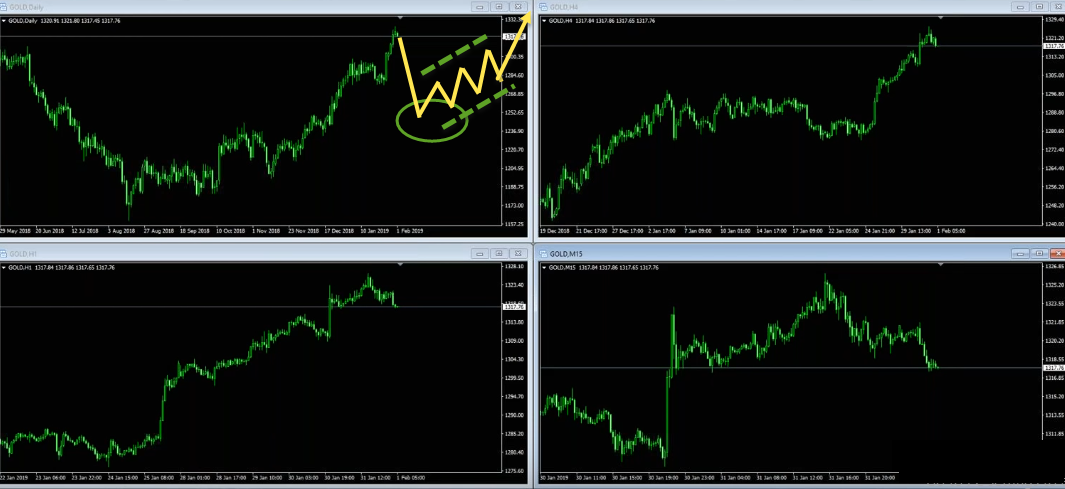
The advantage of multi-timeframe trading is that you will have a clear understanding of what’s going on. For example when you take a look at the chart below, we can see that we have a bullish trend on the daily chart (on the left top), next when we check the H4 chart we can see that we are in a bullish trend (on the right top), we are in a bullish trend on the H1 chart (on the left bottom) as well. When we take a look at the M15 chart (on the right bottom) we can see that it could be in a corrective trend because we have 3 lower highs, 3 lower lows structure and there is a good chance that the price is in a short term correction.
This is how the view of the multi-timeframe helps you to get a clear picture and as per the above scenario in the long term I would be looking for the buys. So if we get a correction as shown in the image below and if the price starts to rise up again then I would be looking for the buy opportunities.
So when you have a clear picture in front of your eyes, it always helps you to remember what are your trading opportunities, are they belong to the short term or scalping or medium term or long term and where are your opportunities coming from. For example if you see any kind of setup on the M15 chart then you should know that it belongs to the short term because many traders think that if they find any setup on the M15 chart they would be able to enjoy the whole move on the daily chart (if that happens) as shown in the image below.
This is a big mistake because you cannot ever make conclusions from the lowest timeframe to the highest timeframe, it’s impossible (for example, it’s like trying to predict that winter has started if you had few drops of rain). So remember when you find your opportunity on a specific timeframe especially if its a lower timeframe then remember that it belongs to the lower timeframe and you have to manage your position accordingly on that timeframe.
Turning Principles
Basically there are several turning principles, in this article I want to discuss about two main ones which I apply and use in my trading. We are going to see how to identify a possible (because nothing is absolute in trading) reversal.
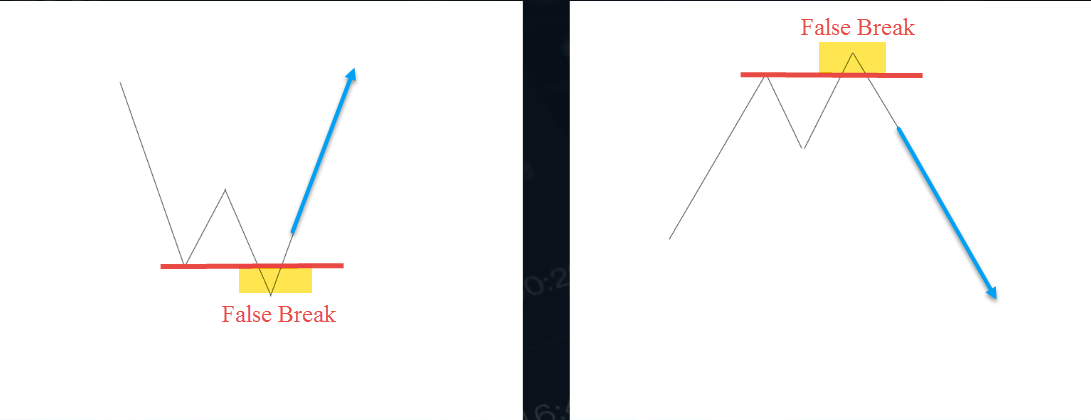
1. The first turning principle is a False Breakout. Looking at the below chart on the left side image we can see that, we had a move down, followed by a pullback and then we got a retrace down to try and create a new low but it was a failed attempt (we call it a false breakout) and retraced up again and closed above the broken level. This represents that the bears are not so powerful here and the bulls might take the control from this point.
Alternatively in the above picture on the right side image we can see a failed attempt to create a new high (false breakout). This represents that the bulls are not so powerful here and the bears might take the control from this point. Basically after a false breakout if the price goes below the previous high (if its a bullish scenario) or the previous low (if its a bearish scenario) then there is a good chance (no warranty) that the price would continue to follow.
How do we increase our chance to be correct?
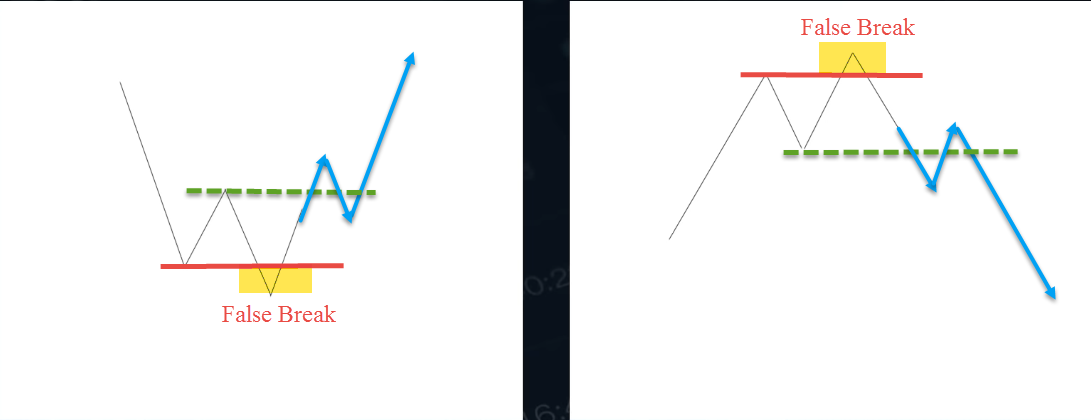
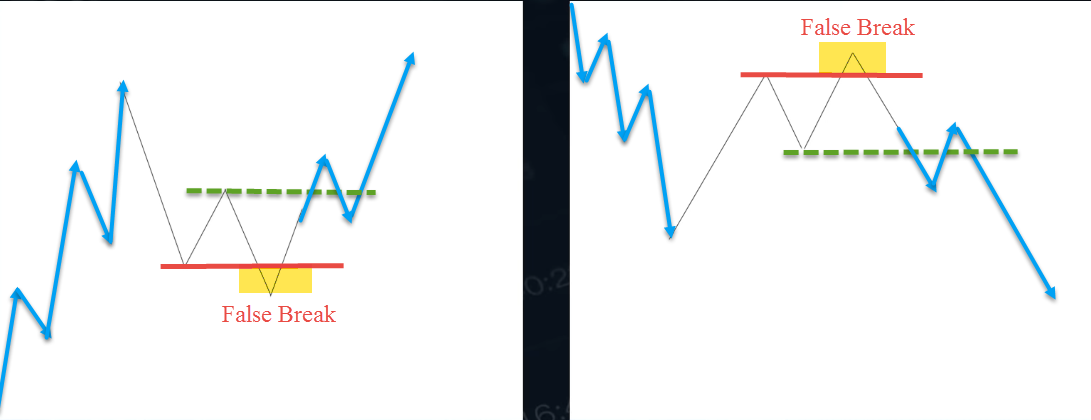
If we trade in the bigger direction then there is an increased chance to be correct, for example lets say we have a bullish trend and then a correction happens with a false breakout then there is a good chance that the price might continue higher (Like as shown in the left side image of the below picture). Alternatively if we have a bearish trend and then a correction happens with a false breakout then there is a good chance that the price might continue lower (Like as shown in the right side image of the below picture).
Here is an example from the real chart:
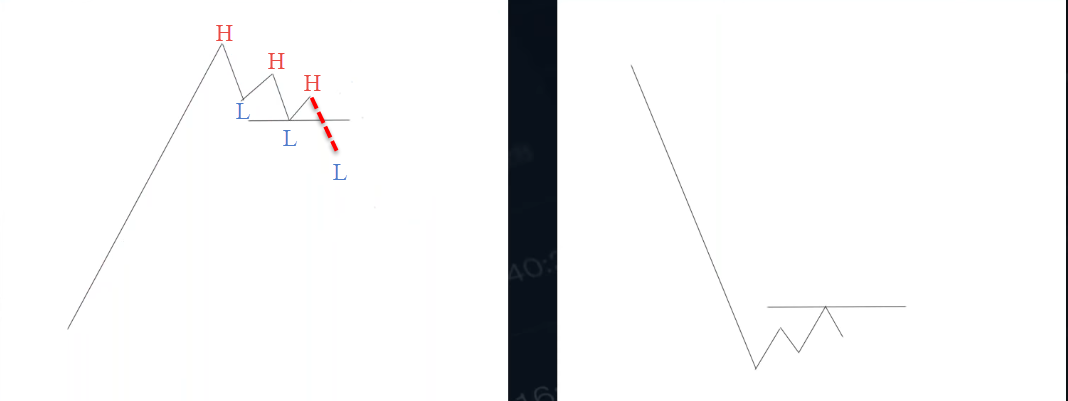
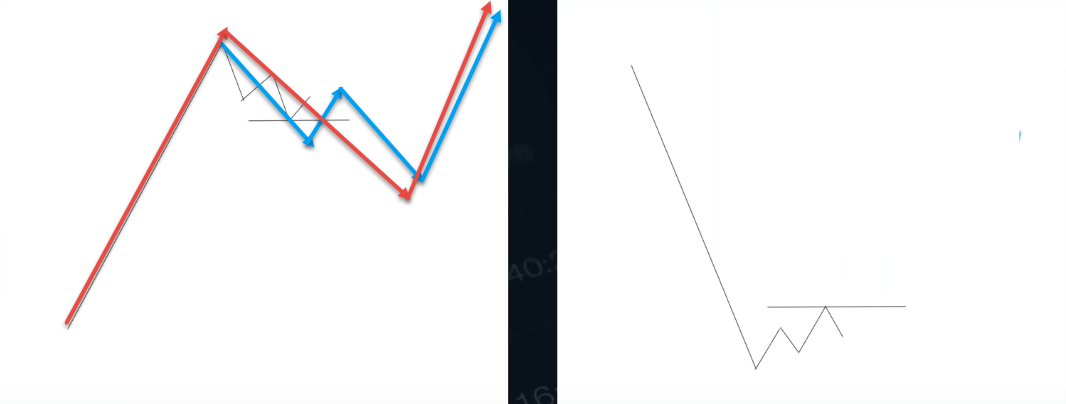
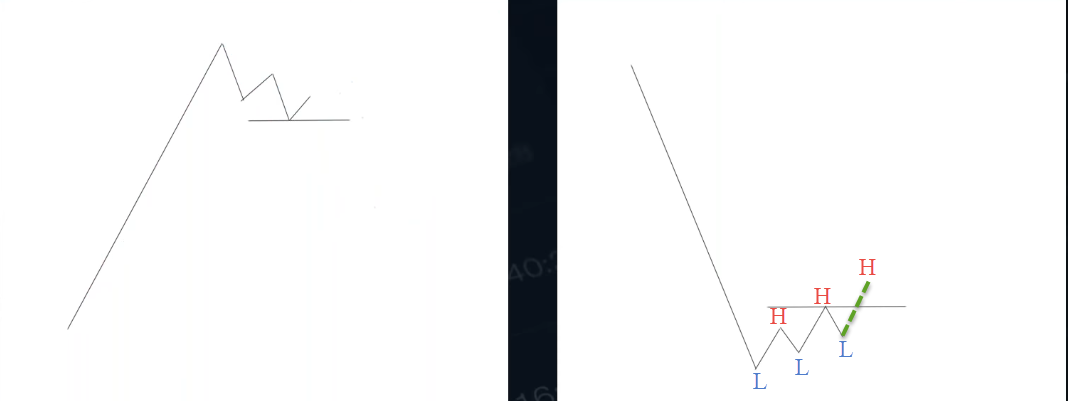
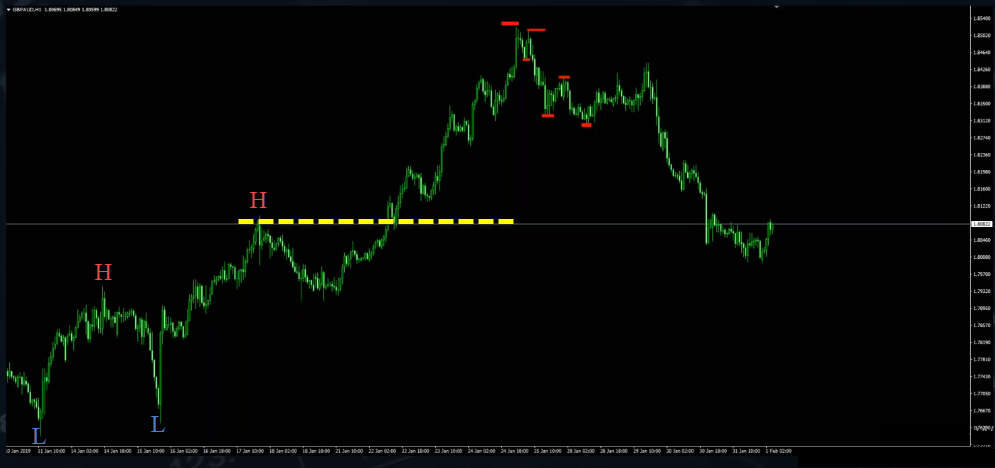
2. The next turning principle is the pure definition of a trend (which I explained you earlier, Bearish trend – 3 lower highs, lower lows, Bullish trend – 3 higher highs, higher lows). In the below image on the left side you can see two lower highs, lower lows and a horizontal line, if the price breaks below this line then we get 3 lower highs, lower lows. This gives us an understanding that there is a good chance that we might see some kind of bearish trend here (of course it will not change the possible longer term trend because for the long term trend to change, the long term has to create a turn around).
This is what we call as a correction and if it happens here then it could be just a very nice correction of something bigger happening on the higher timeframe. In the below image the blue line represents the lower timeframe (for example H1 chart) and the red line represents the higher timeframe (for example D1 chart).
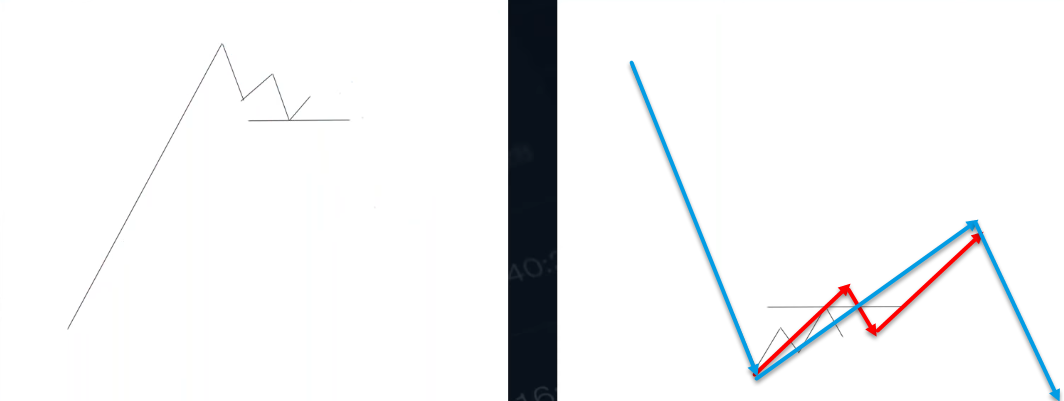
Now lets take a look at an uptrend, in the below image on the right side you can see two higher higher and highers lows and a horizontal line, if the price breaks above this horizontal line then we get 3 higher highs, higher lows. This gives us an understanding that there is a good chance that we might see some kind of bullish trend here (of course it will not change the possible longer term trend because for the long term trend to change, the long term has to create a turn around).
As I mentioned earlier this doesn’t necessarily has to change the possible bigger trend. In the below image the red line represents the lower timeframe (for example M15 chart) and the blue line represents the higher timeframe (for example H4 chart). It’s very important to remember and understand that the red line could represent just a correction, for example it could lead to some kind of a bullish trend on the M15 chart and doesn’t necessarily has to change the possible bigger trend on the H4 chart.
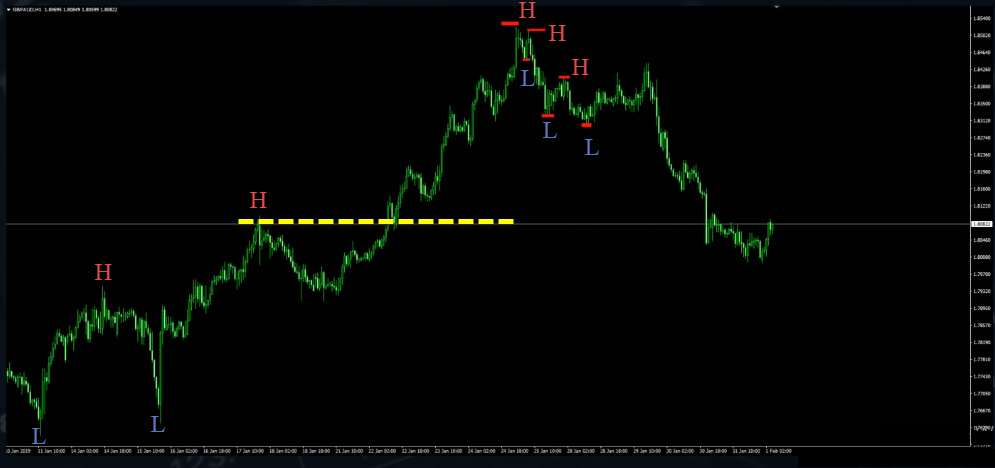
Here is an example from the real chart:
In the below chart we have a big bullish trend as we have several highs and lows going up.
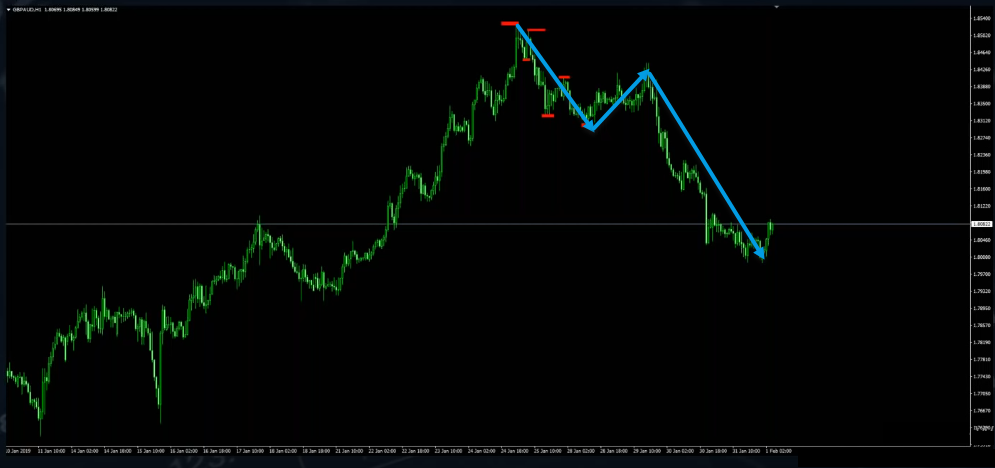
Then they changed and the price created lower highs, lower lows.
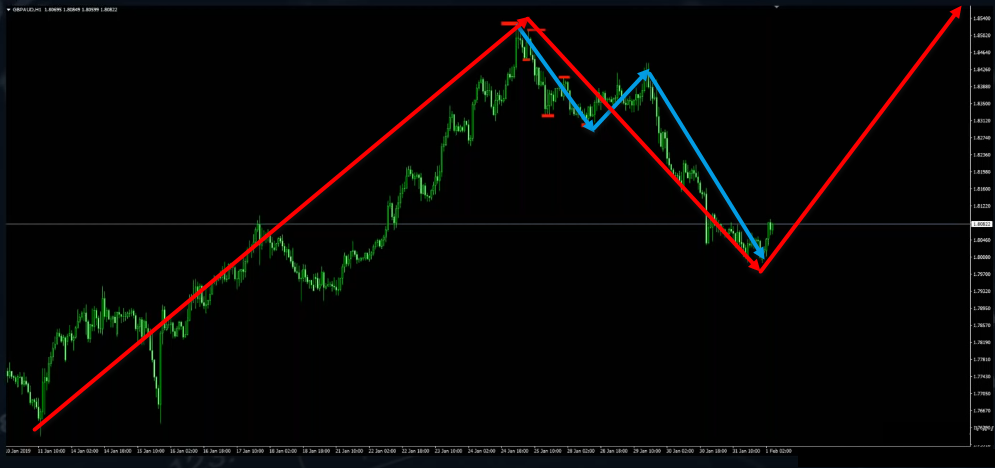
So there is a good chance that the price might be exposed to some sort of a correction.
But keep in mind that this will not necessarily change the bigger trend here and don’t rush to make any conclusions here. We need to make conclusions from the facts that we get from the timeframe we work with.
Charts Only Trading Strategy – Important Notes
Finally here are some important notes that I wanted to share with you based on this charts only trading strategy:
- You can combine any 3 timeframes or even 4 timeframes to work with.
- Define and work with clean instruments!
- Avoid uncertainty.
- Work with small risk – big reward principle!
- Wait for your setup – DO NOT create one!
- Remember, don’t try to revenge the market for a loss, the next opportunity will be right across the corner and if you will focus on revenge – you will miss it!
- Not everyday you will find tons of opportunities! Have your patience!
- Track record your performance to find out your strong and weak points!
Watch the webinar of How To Trade With Price Action Only (No Indicators!)
I invite you to join me in my live trading rooms, on daily basis, and improve your trading with us.
Also you can get one of my strategies free of charge. You will find all the details here
Thank you for your time reading this article.
To your success,
Vladimir Ribakov












Thank you sir
You are very welcome
Thank you Vlad for explaining it
My pleasure Brat
Thank you Vlad, it was too useful