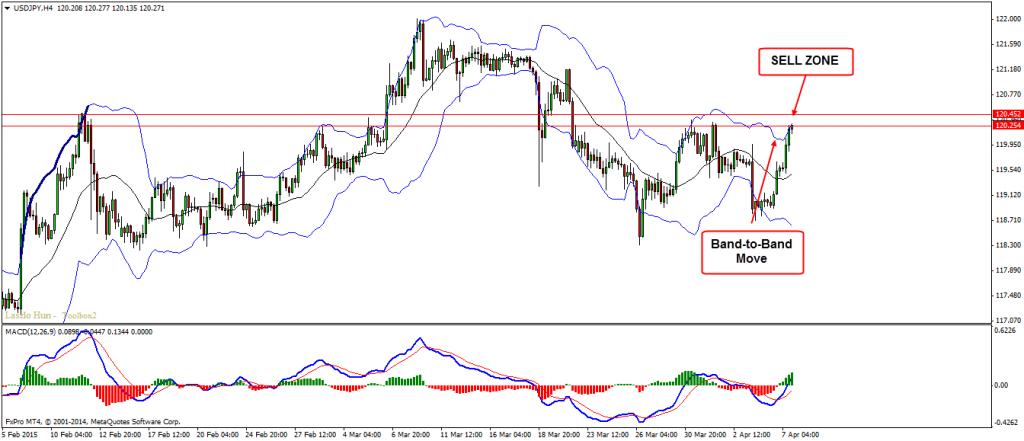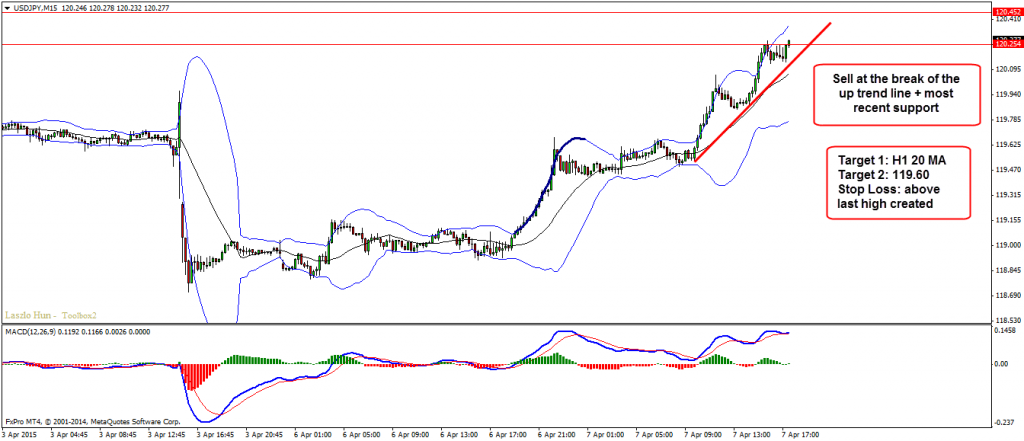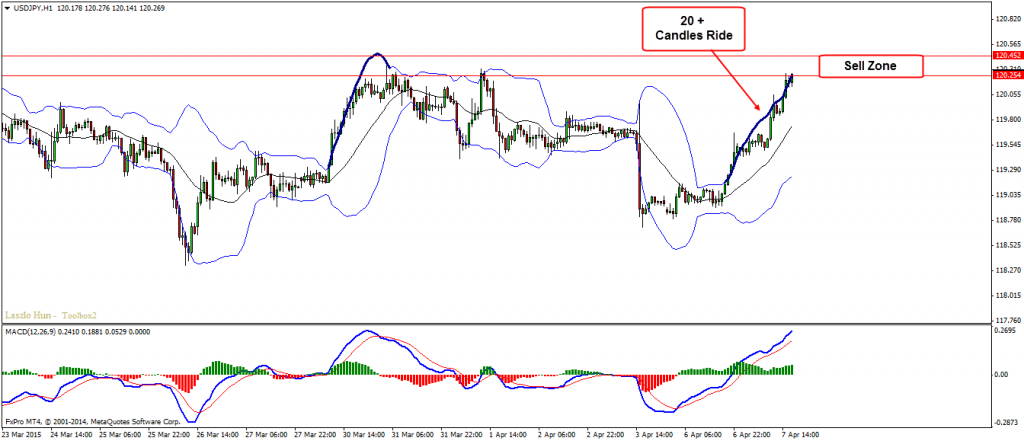
The USDJPY pair made a strong move up, creating band to band move on the H4 chart which is also a key resistance level. The plan is very simple we drop down to intraday time frame and look for a break of the most recent trend line in order to trigger the sell.
Technical Analysis:
H4 – band to band move on the bollinger bands, resistance
Entry:
M15 – Look for break of the most recent up trend line and last support zone inside the SELL ZONE.
Target 1: H1 20 MA
Target 2: 119.60
Stop Loss: above last high created
Video Explanation:


