Look for buy setups after the break of the triangle in AUDUSD

0
525

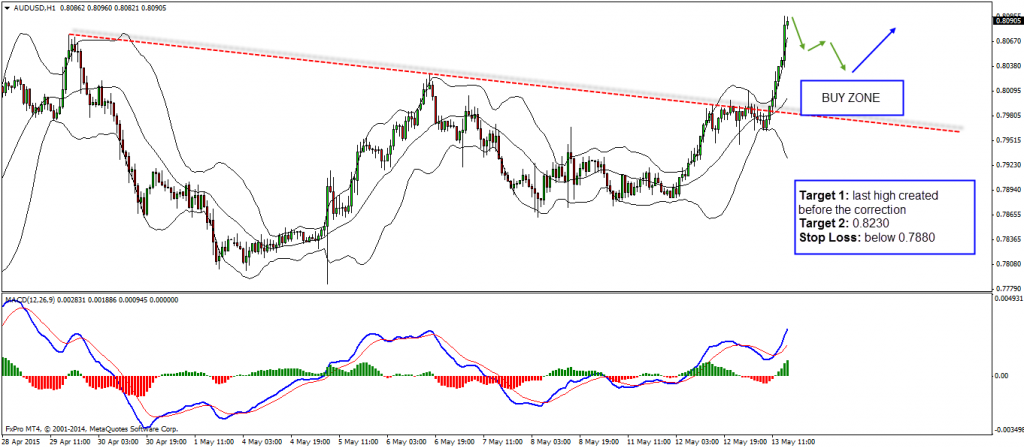
AUDUSD looks very interesting after the break of the triangle well seen on the H4 chart. The situation is pretty simple – we should now look for double wave correction down (you may drop to the H1 chart to spot it easier) and once completed we can look for buy opportunities. Ideally we want to see the price coming closer to a support, along with hidden bullish divergence to form.

Technical Analysis:
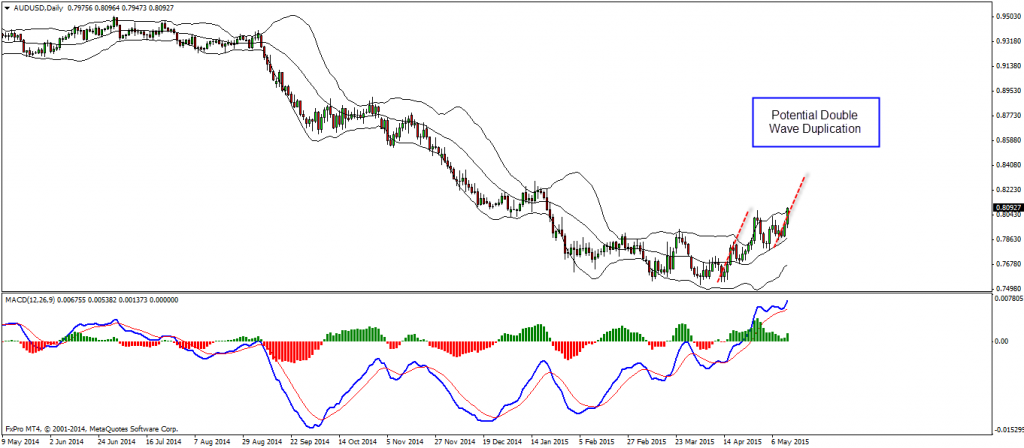
D1 – potential double wave duplication

AUDUSD-D1-1024x448

H4 – break of triangle, potential double bollinger band duplication

AUDUSD-H4-1024x448

Entry:
H1 – wait for double wave correction down, ideally with hidden bullish divergence to form near a support zone
Target 1: last high created before the correction
Target 2: 0.8230
Stop Loss: below 0.7880

AUDUSD-H1-1024x448

Video Explanation:

Yours,
Vladimir

– See more at: http://vladimirribakov.com/forex-market-updates/look-for-buy-setups-after-the-break-of-the-triangle-in-audusd/#sthash.nIYS5dNP.dpuf

Previous articleBuying dips in EURGBP preferred
Next articleLook for sell opportunities in USDJPY
Following 11+ years of trading experience, trading my own accounts as well as for hedge funds and brokerages, I have decided to fulfill my destiny and to personally mentor Forex and Commodities traders. When I released the “Broker Nightmare” (software that hides trades from brokers) 8 years ago, I found an overwhelming number of frustrated people who genuinely wanted to learn how to trade the Forex market, but instead found themselves scammed and misled. Over the years I have also release other trading systems based on my trading strategies, and met a lot of people on my worldwide Forex seminars. We’ve formed a close Forex community and we meet once or twice a year in various locations in Europe.
Subscribe
Notify of
guest

0 Comments
Newest
Oldest Most Voted
Inline Feedbacks
View all comments