Bollinger bands is one of my favorite indicators for a very long time now because in my opinion is one of the best indicators out there. It can be used in my different ways but for some reason a lot of traders never go familiar with it. I have used different sources in order to gather as much information as possible and make these two articles as complete as possible. I also have two webinars which I highly recommend you to check out to find out some of my ways and secrets on this indicator which I didn’t include in this article. Watch “The Bollinger Bands Secrets Webinar” and here you can watch “The Band to Band Move in Bollinger Bands” .
Bollinger Bands Introduction
Bollinger Bands are applied directly to price charts, providing a gauge for how strong a trend is, and spotting potential bottoms and tops in stocks prices. Band width fluctuates based on volatility; the ability for Bands to adapt to changing market conditions makes it a popular indicator amongst traders. To use Bollinger Bands effectively, we must understand how they work, their trading applications, and pitfalls.
What are the Bollinger Bands?
Bollinger Bands® are a volatility based indicator, developed by John Bollinger, which have a number of trading applications.
There are three lines that compose Bollinger Bands: A simple moving average (middle band) and an upper and lower band. These bands move with the price, widening or narrowing as volatility increases or decreases, respectively. The position of the bands and how the price acts in relation to the bands provides information about how strong the trend is and potential bottom or topping signals.
Bollinger Bands are used on all timeframes, such as daily, hourly or five-minute charts. Bollinger Bands have two adjustable settings: the Period and the Standard Deviation. The Period is how many price bars are included in the Bollinger Band calculation. The number of periods used is often 20, but is adjusted to suit various trading styles.
The Standard Deviation is typically set at 2.0, and determines the widths of the Bands. The higher the Standard Deviation, the harder it will be for the price to reach the upper or lower band. The lower the Standard Deviation the easier it is for price to “breakout” of the Bands.
Bollinger Bands denoted (20,2) means the Period and Standard Deviation are set to 20 and 2, respectively.
The indicator is calculated using the following formula. First calculate the Middle Band, then calculate the Upper and Lower Bands.
- Middle Band = 20-day simple moving average (SMA).
- Upper Band = 20-day SMA + (20-day standard deviation of price x 2).
- Lower Band = 20-day SMA – (20-day standard deviation of price x 2).
Where SMA = the sum of closing prices over n periods / by n.
Figure 1 shows how Bollinger Bands looks on a chart as they move and adapt with price.

22 Bollinger Band Rules
- Bollinger Bands provide a relative definition of high and low. By definition price is high at the upper band and low at the lower band.
- That relative definition can be used to compare price action and indicator action to arrive at rigorous buy and sell decisions.
- Appropriate indicators can be derived from momentum, volume, sentiment, open interest, inter-market data, etc.
- If more than one indicator is used the indicators should not be directly related to one another. For example, a momentum indicator might complement a volume indicator successfully, but two momentum indicators aren’t better than one.
- Bollinger Bands can be used in pattern recognition to define/clarify pure price patterns such as “M” tops and “W” bottoms, momentum shifts, etc.
- Tags of the bands are just that, tags not signals. A tag of the upper Bollinger Band is NOT in-and-of-itself a sell signal. A tag of the lower Bollinger Band is NOT in-and-of-itself a buy signal.
- In trending markets price can, and does, walk up the upper Bollinger Band and down the lower Bollinger Band.
- Closes outside the Bollinger Bands are initially continuation signals, not reversal signals. (This has been the basis for many succeuful volatility breakout systems.)
- The default parameters of 20 periods for the moving average and standard deviation calculations, and two standard deviations for the width of the bands are just that, defaults. The actual parameters needed for any given market/task may be different.
- The average deployed as the middle Bollinger Band should not be the best one for crossovers. Rather, it should be descriptive of the intermediate-term trend.
- For consistent price containment: If the average is lengthened the number of standard deviations needs. to be increased; from 2 at 20 periods, to 2.1 at 50 periods. Likewise, if the average is shortened number of standard deviations should be reduced; from 2 at 20 periods, to 1.9 at 10 periods.
- Traditional Bollinger Bands are based upon a simple moving average. This is because a simple average is used in the standard deviation calculation and we wish to be logically consistent.
- Exponential Bollinger Bands eliminate sudden changes in the width of the bands caused by large price changes exiting the back of the calculation window. Exponential averages must be used for BOTH the middle band and in the calculation of standard deviation.
- Make no statistical assumptions based on the use of the standard deviation calculatio in the construction of the bands. The distribution of security prices is non-normal and the typical sample size is most deplyments of Bollinger Bands is too small for statistical significance. (In practice we typically find 90%, not 95%, of the data inside Bollinger Bands with the default parameters)
- %b tells us where we are in relation to the Bollinger Bands. The position within the bands is calculated using an adaptation of the formula for Stochastics .
- %b has many uses; among the more important are identification of divergences, pattern recognition and the coding of trading systems using Bollinger Bands.
- Indicators can be normalized with %b, eliminating fixed thresholds in the process. To do this plot 50- period or longer Bollinger Bands on an indicator and then calculate %b of the indicator.
- BandWidth tells us how wide the Bollinger Bands are. The raw width is normalized using the middle band. Using the default parameters BandWidth is four times the coefficient of variation.
- BandWidth has many uses. Its most popular use is to indentify ‘The Squeeze., but is also useful in identifying trend changes…
- Bollinger Bands can be used on most financial time series, including equities, indices, foreign exchange, commodities, futures, options and bonds.
- Bollinger Bands can be used on bars of any length, 5 minutes, one hour, daily, weekly, etc. The key is that the bars must contain enough activity to give a robust picture of the price-formation mechanism at work.
- Bollinger Bands do not provide continuous advice; rather they help indentify setups where the odds may be in your favor.
A note from John Bollinger:
One of the great joys of having invented an analytical technique such as Bollinger Bands is seeing what other people do with it. These rules covering
the use of Bollinger Bands were assembled in response to questions often asked by users and our experience over 25 years of using the bands. While there
are many ways to use Bollinger Bands, these rules should serve as a good beginning point.
Finding tops and bottoms with Bollinger Bands
After setting your Bollinger Bands to 2.5 standard deviations, you will see that price reaches the outer bands less often. At the same time, the meaning of such signals becomes much more important because it shows significant price extremes.
We highly recommend combining the Bollinger Bands with the RSI indicator – it’s the perfect match. There are two types of tops that you need to know about:
1) Price spikes into the outer Bollinger Bands which get rejected immediately >> Reversal signal.
2) After a trend move, price fails to reach the outer Band as the trend becomes weaker. This signal is usually accompanied by an RSI divergence >> Continuation signal.
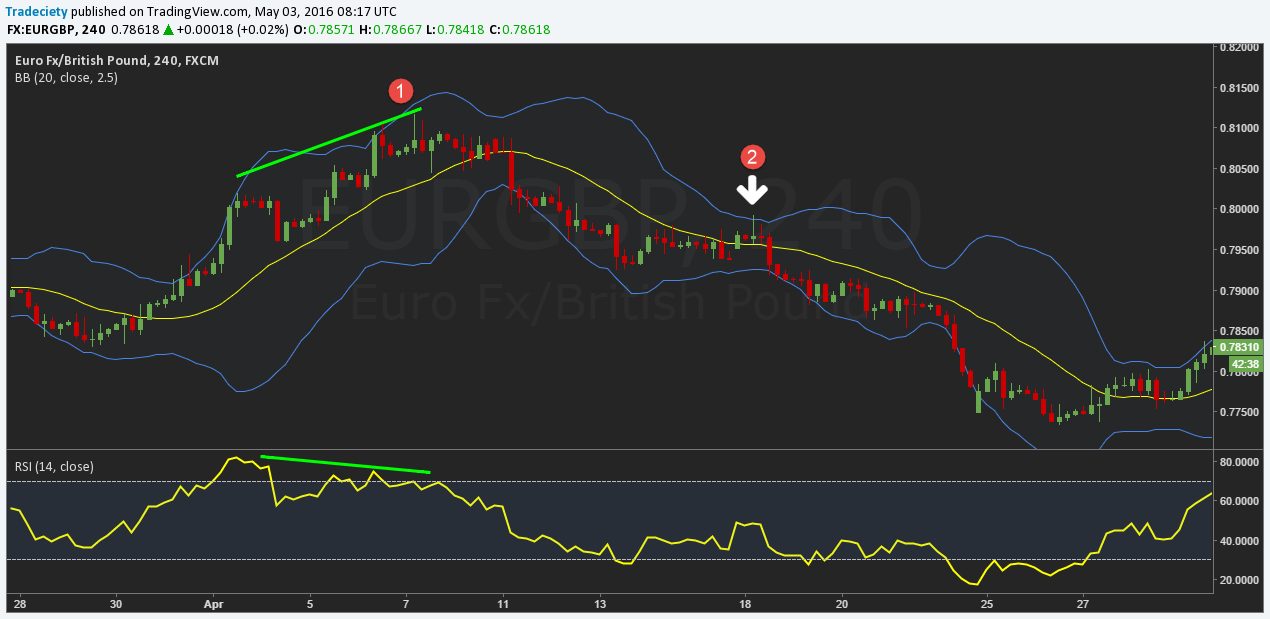
The screenshot below shows both scenarios: the first is the market top after a divergence – see how the trend became weaker and lost momentum and then eventually failed to reach the outer Band before reversing. I marked the second spike with an arrow – this was a trend continuation signal as price failed to break higher during the downtrend. The strong spike that was followed by a fast rejection showed that bulls lacked power.

Trend-trading with the Bollinger Bands
In contrast to most other indicators, the Bollinger Bands are non-static indicators and they change their shape based on recent price action and accurately measure momentum and volatility. Thus, we can use the Bollinger Bands to analyze the strength of trends and get a lot of important information this way. There are just a few things you need to pay attention to when it comes to using Bollinger Bands to analyze trend strength:
- During strong trends, price stays close to the outer band.
- If price pulls away from the outer band as the trend continues, it shows fading momentum.
- Repeated pushes into the outer bands that don’t actually reach the band show a lack of power.
- A break of the moving average is often the signal that a trend is ending.
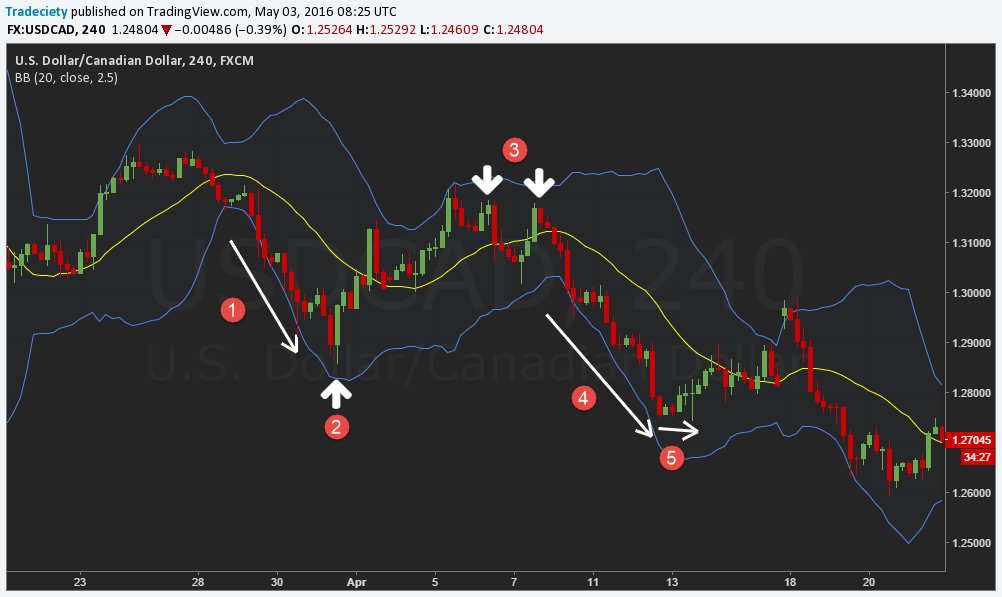
The screenshot below shows how much information a trader can pull from using Bollinger Bands alone. Let me walk you through the points 1 to 5:
1) Price is in a strong downtrend and price stays close to the outer bands all the time – very bearish signal.
2) Price fails to reach the outer band and then shots up very strongly, even showing an engulfing pattern. This is a classic reversal pattern where the bearish trend strength faded.
3) 3 swing highs with lower highs. The first swing high reached the outer band whereas the following two failed – fading strength.
4) A strong downtrend where price stayed close to the outer band. It tried to pull away, but bears were always in control.
5) Price consolidates sideways, not reaching the outer band anymore and the rejection-pinbar ended the downtrend.
As you can see, the Bollinger Bands alone can provide a lot of information about trend strength and the balance between bulls and bears.

The role of the moving average
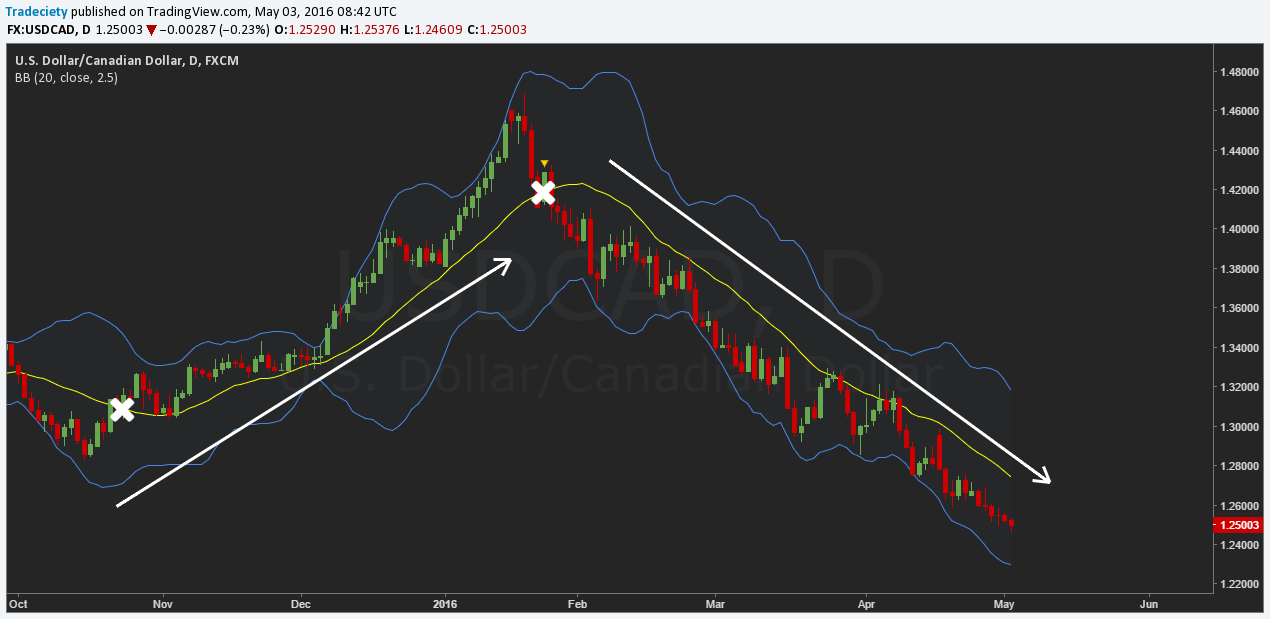
During trends, the moving average holds very accurately and a break of that moving average is usually a meaningful signal that the sentiment has shifted. The screenshot below shows nicely how price trended between the outer bands and the moving average both on the way up and down. During the trend, the moving average could have been used as a re-entry signal to add to existing positions during pullbacks.
Furthermore, the moving average can be used as a trade exit signal where a trader does not close his existing positions unless price has broken the moving average. By combining the Bollinger Bands with the moving average, a trader can already create a robust trading method.
You can see, the Bollinger Bands are a multi-faceted trading indicator that can provide you with lots information about trend, buy/seller balances and about potential trend shifts. Together with the moving average and the RSI, Bollinger Bands make for a great foundation for a trading strategy.

This is where we stop for this post. I hope it was useful to you! Looking forward to hear your thoughts/comments idea and suggestions. How do you use it? Don’t forget to like and share on social media.
Yours,
Vladimir
Sources: en.wikipedia.org | http://traderhq.com/ | http://www.bollingerbands.com/ | http://www.tradeciety.com/


thanks, for the article. i m a bit type of bollinger hunter. why? i use about 14 indicators. so far bolliger have never failed me. i usually use tripple bollinger with different sma which gives me quite precise condition of ongoing market. n breakout, it never failed till now whether down or up. This article helped me to understand more about it. before i had surface knowledge only but now i hav started digging more n more though it has simple formula. hahaha. bollinger if used single only can help u know direction of market too with candle patterns touching… Read more »
Thanks for sharing your view on Bollinger Bands, I appreciate it!
Hi guys and thank you for the positive comments!
@John – Yes, from my experience I can say that we can rarely depend on a single indicator for reliable signals and make money in the long run.
Part two coming in a bit!
I used to trade the breakout but it looks like it needs an extra filter/confirmation to maybe trade only in the direction of the trend for example…
Nice one! Looking forward to part 2.
Good article, will save this guide for reference.
Very useful guide on BOLLINGER BANDS… whys and wherefores are covered perfectly..
Ahhh….a complete guide on Bollinger Bands…This is what exactly I was looking for
Fantastic coverage on Bollinger Bands, the rules are precise…I will sure diarize this part of your guide. It really helps.