
Introduction to Candlestick Patterns
In technical analysis, a candlestick pattern is a movement in prices shown graphically on a candlestick chart that some believe can predict a particular market movement. The recognition of the pattern is subjective and programs that are used for charting have to rely on predefined rules to match the pattern. There are 42 recognised patterns that can be split into simple and complex patterns.
Some of the earliest technical trading analysis was used to track prices of rice in the 17th century. Much of the credit for candlestick charting goes to Munehisa Homma (1724–1803), a rice merchant from Sakata, Japan who traded in the Ojima Rice market in Osaka during the Tokugawa Shogunate. According to Steve Nison, however, candlestick charting came later, probably beginning after 1850.
How Candlesticks Form?
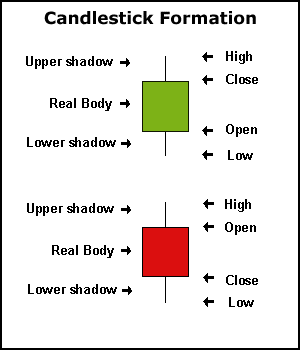
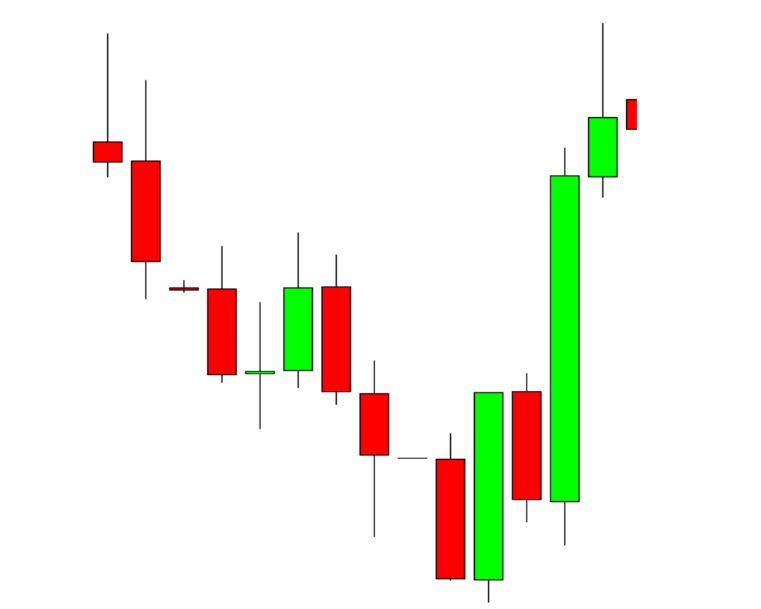
Candlesticks are graphical representations of price movements for a given period of time. They are commonly formed by the opening, high, low, and closing prices of a financial instrument.
If the opening price is above the closing price then a filled (normally red or black) candlestick is drawn.
If the closing price is above the opening price, then normally a green or a hollow candlestick (white with black outline) is shown.
The filled or hollow portion of the candle is known as the body or real body, and can be long, normal, or short depending on its proportion to the lines above or below it.
The lines above and below, known as shadows, tails, or wicks represent the high and low price ranges within a specified time period. However, not all candlesticks have shadows.
Simple and Complex Candlestick Patterns
We can separate the candlestick patterns into two categories: simple and complex
Simple Candlesticks are the ones that consist of one candlesticks alone while complex formations might consist of 2-3 even 4 candles.
You will find different names for the same candlestick formations and that shouldn’t worry you as long as you learn how to use them best in your advantage.
Most Powerful Japanese Candlestick Patterns I
Engulfing Pattern
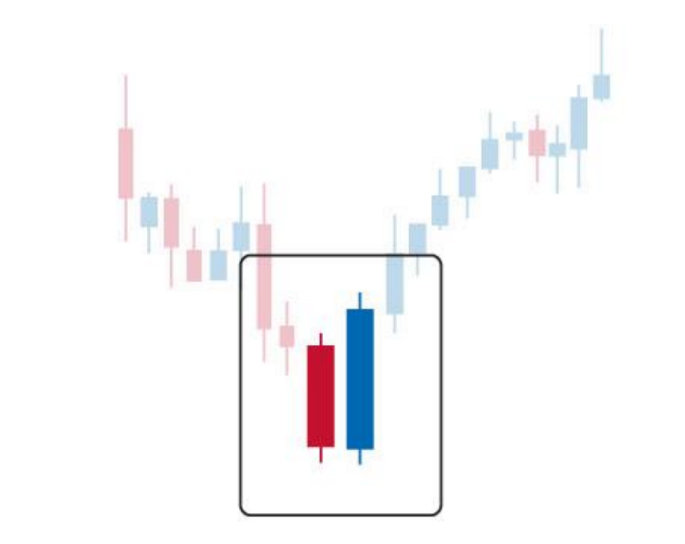
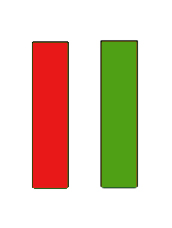
The engulfing pattern forms when the previous day’s candle is completely eclipsed or engulfed by the next day’s candle. At the end of a downtrend we will find bullish engulfing:
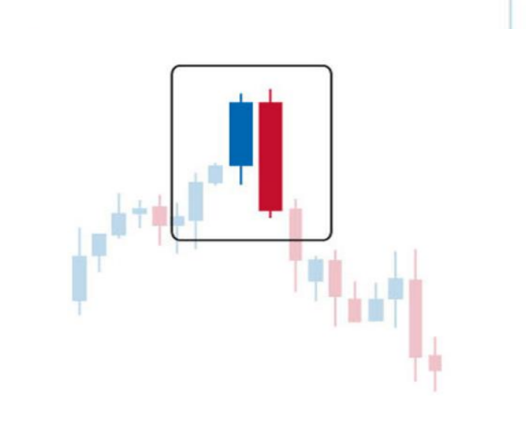
On the other hand we will be looking for bearish engulfing at the end of a bullish trend:
There are variations when it comes to the shadows of the first candle. Some want the body of the 2nd candle to completely engulf the previous candlestick (body + shadow) and some would not care about the wigs. In my trading experience i have found out that the difference isn’t very significant. What’s you opinion? Which way do you use it? Please share your view in the comment section below.
Here is an example of bullish engulfing:
Very often after the engulfing candle, the price will correct itself, giving the traders a great opportunity to jump in a trade with a great risk:reward ratio. A simple rule of the thumb here could be: set the limit order at 50% of the engulfing candle. In other words if the whole candle is 50 pips (high to low) set your buy or sell pending right in the middle at 25 pips, where the price is very likely to correct to.
Bearish Engulfing Example
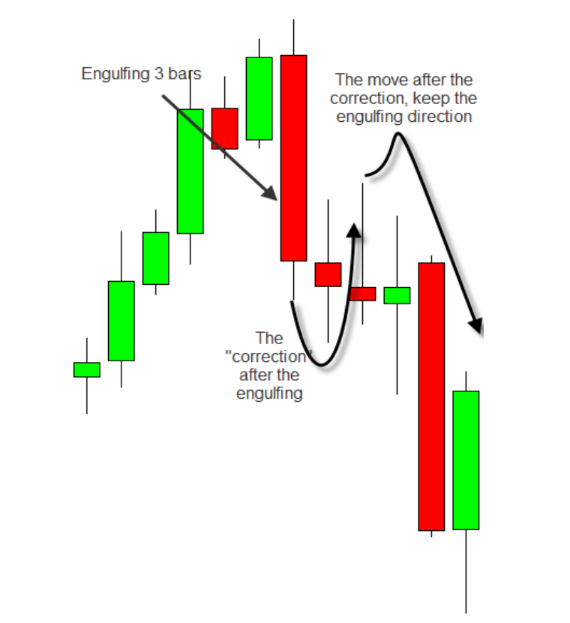
Why does the engulfing pattern appear?
As you already probably know markets are representation of the traders sentiment and emotions (greed/fear). Engulfing would occur at the end of a trend because when the price has been moving in one direction for long enough, traders would start collecting profits. When the cashing out begins we will see this sharp move in the opposite direction and most likely the beginning of a counter trend.
The Marubozu Pattern
The next pattern that I would like to share with you is the Marubozu. The classical or complete marubozu candle is represented only by a body; it has no wicks or shadows extending from the top or bottom of the candle. If the candle has wicks only from one side then it falls into another category – either an Opening or Closing Marubozu.
Let’s have a look at each type.
Complete Marubozu – as already mentioned above, this pattern doesn’t have wigs above or below.
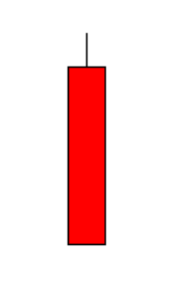
And here is how the opening Marubozu looks like – This bearish candlestick has opened from the upper side of the candlestick and kept falling. There is no shadow above the opening price.
Closing Marubozu – This candlestick has closed with no shadow below the closing price.
How to read the Marubozu pattern?
It is very simple actually. This pattern foreshadows a reversal in the main trend. It doesn’t matter whether the current trend has been up or down. If you see this pattern it is a good idea to book profits as chances are price is about to reverse.
Examples:
See how the price changed directions after the Marubozu Close.
In the second example the trend switches from bearish to bullish.
Both the engulfing and the marubozu patterns could be used as both Entry and Exit strategies. If you are already in a trade both setups hint you that it is very likely for the price to switch direction. At this point you should at least break even your trade, or break even and close partially.
Of course combining the patterns with other methods and techniques will give you even better results. Also keep in mind that an engulfing on the M15 chart won’t have the same success rate as the H4 chart engulfing.
An interesting subject here is the statistics. Not many are talking about it BUT it is a fact that computers and algorithms are in control of the markets. Same are coded to recognize the patterns that traders used for tens of years (some techniques are over 100 years old, believe it or not). The statistics we were relying on just a few years ago are not accurate anymore. Hedge funds and banks are taking advantage of the commonly used techniques used by retails and other traders found in papers and books since many years. They know these methods are used by many people and the crowd would rely on them. This is where the market makers take the candy from the kid. It is that easy.They have the resource to build the software that will recognize the patterns just like a human trader would do, they have the resource to move the market in the direction they want. Job done.
This is the ugly reality. This is our time. I’m not saying that to discourage you but rather to get you motivate you. Don’t blindly trust papers and rely on them to be true. Perhaps the patterns or strategy or method was and is still working but not as good as it used to. We, the retail traders must adapt or die. Every generation has its own problems. Those are hours. But as I said above, it is not impossible. When combined with other methods and techniques it all comes in place. One such example is Fibonacci levels, trend lines, false breaks…
After all I prefer dealing with extra confirmations rather than doing this kind of business by drawing my own charts, calling on the phone etc… As I said every generations has its own problems.
Stay tuned for part II where i will introduce you to other interesting patterns. Now go ahead and open your chart. Do your home work and study the patterns. Notice the difference between the m15 the H1 and H4 charts. Try different combinations where you combine other tools of your trading arsenal and see which one works best for you. I expect your questions in the comment section below.
Source: Wikipedia.com, The Secret Meaning Of Japanese Candlesticks (free e-book)
Yours,
Vladimir




Very well explained! Is there (besides what is given in part two)another page or link that has empirically observed success probability of different patterns?
Hi
Thank you!
You can find many more valuable things in my YouTube channel –
https://www.youtube.com/channel/UCVK2kyAJVsIc4lOTWJ1loSA?view_as=subscriber
Including all the webinars related to the subject
All the best!