In the dynamic world of trading, having a reliable strategy is like having a compass in a vast sea of financial markets. In this article, we’ll take a closer look at my high-accuracy trading strategy, breaking down complex concepts into simple terms. Whether you’re a seasoned trader or just starting, understanding the nuances of this strategy can be a game-changer in your trading journey. This strategy, rooted in a three-time frame approach, aims to provide a comprehensive understanding of not only what to do but also how and why to do it. So, let’s embark on this exploration of key trading principles and strategies that I employ for consistent success.
This article is available to you, thanks to the support of our recommended broker Eight Cap
Explore My Free Mentorship Program
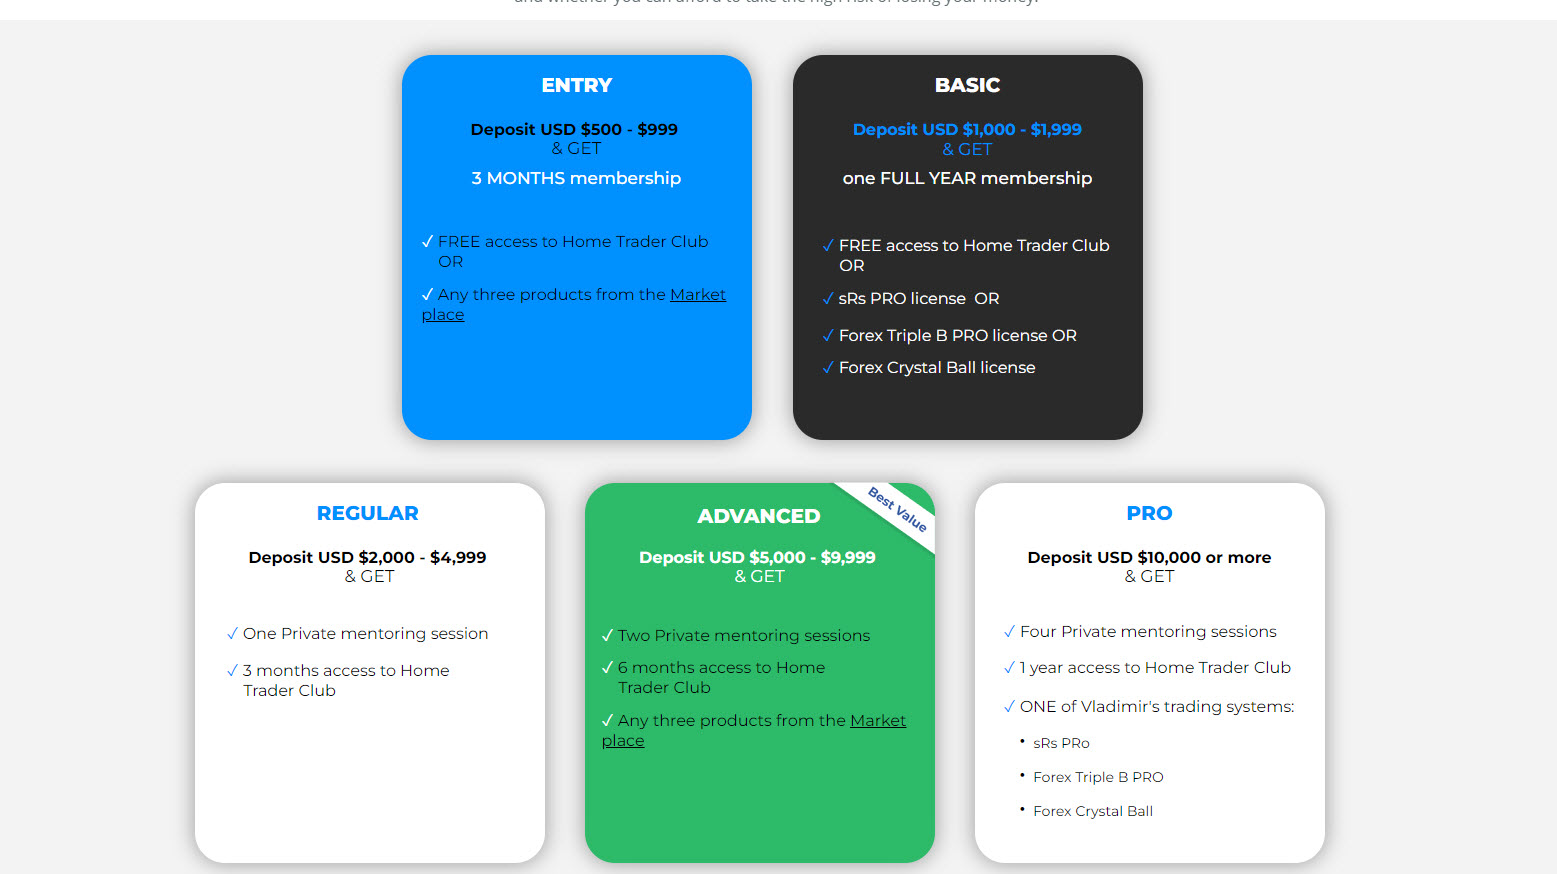
As an Internationally Certified Financial Technician (CFTe, IFTA) and former private capital hedge fund trader, I have successfully mentored numerous students who are now thriving in the trading world. Students who learned with me, are now full-time traders, work in the trading industry, run their own capital firms or are fully funded traders by private companies, develop automated trading solutions and manage others’ capitals. I am a very proud mentor and I am proud of the success stories I’ve helped create, and for a limited time, I’m offering my mentorship program for free through a partnership with Eight Cap broker. Join Eight Cap, become an active trader, and choose the offer that suits you best –
For more details, visit: Home Trader Club Mentorship Program
I’m excited to work with you and help you reach your desired level of success!
Identifying Key Trading Levels:
The first step in this trading strategy involves the meticulous task of identifying key trading levels. This process is akin to finding landmarks in a foreign terrain—a crucial guide for making strategic decisions.
Why is this important?
Imagine you’re navigating through a dense forest, and every now and then, you encounter clearings or distinctive markers. These markers represent points on the trading charts where the market has responded strongly in the past. We need to search for these significant levels, which could be areas characterized by high demand or supply, crucial trendlines, or notable support and resistance points.
These levels act as historical touchpoints where the market has exhibited notable reactions. It’s as if the market has left footprints at these locations, indicating moments of significant price movements. Starting the analysis from these proven levels lays the foundation for the trades. It’s akin to planning a journey by acknowledging the terrain’s contours and choosing paths that others have successfully traded before.
How does this increase the chances of success?
Trading from these established levels enhances the likelihood of making successful trades. It’s like choosing to fish in a pond with known abundance rather than casting your line into unknown waters. These key levels offer insights into where the market might react again, providing a solid starting point for crafting effective trading strategies.
Analyzing Weekly Charts:
The next step involves a meticulous examination of weekly charts—a practice that mirrors stepping back to gain a panoramic view of the financial landscape. This panoramic perspective is instrumental in grasping the overarching trends and historical market dynamics.
Why do we prioritize weekly charts?
Think of the weekly chart as a comprehensive map that outlines the grand terrain of market movements over a more extended period. I would like to initiate my analysis by delving into this expansive timeframe, which enables me to comprehend the macroscopic trends shaping the financial realm. This approach is comparable to climbing a hill to survey the entire landscape before embarking on a journey.
The weekly chart serves as a time capsule, encapsulating the essence of price movements over each trading week. By immersing ourselves in this broader timeframe, we gain insight into the overarching trend—a bird’s eye view of whether the market is predominantly bullish or bearish.
Identifying Seller/Buyer Dominance:
Within this weekly chronicle, we need to look specifically for the historical points where sellers/buyers have exerted control. Much like a historian studying pivotal moments in history, these as crucial junctures where market sentiment shifted, and sellers/buyers took the reins.
Predicting Changes in Market Direction:
Understanding how prices sway over weeks provides a treasure trove of insights. Just as seasons change, markets exhibit shifts in direction. By recognizing these shifts early on, we can position ourselves strategically, ready to navigate the evolving market dynamics.
Spotting Divergences:
The next step involves a keen eye for spotting divergences—a skill that resembles detecting subtle shifts in the wind before a storm. These divergences serve as early warnings, signalling potential changes in the market’s momentum.
Picture yourself sailing on the ocean, and you have instruments that measure the wind’s speed and direction. I employ similar tools in the form of indicators like MACD (Moving Average Convergence Divergence), RSI (Relative Strength Index), and moving averages. These instruments act as compasses, guiding me through the complex currents of market movements.
Understanding Divergences:
A divergence occurs when the price of an asset is on an upward or downward trajectory, but the accompanying indicators tell a different tale. We need to compare the movement of prices with the insights provided by these indicators. If the price and the indicators diverge, then it raises a red flag.
Why are divergences crucial?
Imagine you’re on a ship, and the sails are billowing with the wind, indicating a smooth journey. However, if your wind instruments suddenly suggest a contrary breeze, you’ll be alerted to potential turbulence. Similarly, in trading, divergences act as early indicators that the market’s momentum might be changing, hinting at a possible reversal in the prevailing trend.
Verifying on Daily and 4-Hour Charts:
The next step involves a verification process on both daily and 4-hour charts—a practice reminiscent of double-checking coordinates before embarking on a journey. This multi-timeframe approach adds a crucial layer of assurance to your trading decisions.
Why Daily and 4-Hour Charts?
Consider yourself as an explorer navigating through diverse landscapes. Having identified key trading levels and spotted bearish divergences, you need to understand the importance of ensuring that these signals resonate harmoniously across different time frames. The daily and 4-hour charts serve as his compass and sextant, validating the consistency of your analysis.
Think of daily charts as the macro view, providing a comprehensive overview of market movements over each trading day. On the other hand, the 4-hour charts offer a more granular perspective, zooming in to capture the intricacies of price fluctuations within shorter time frames. By cross-referencing these two, you seek confirmation that the identified levels and divergences persist across different temporal dimensions.
Layer of Confidence:
Trading decisions are akin to making calculated leaps of faith. Multi-time frame verification acts as a safety net, instilling an additional layer of confidence in his analyses. It’s akin to having multiple navigational instruments, each corroborating the other, reducing the margin for error.
Adaptability to Market Dynamics:
Markets are dynamic, and what holds true on a weekly chart may evolve differently on a daily or 4-hour chart. Multi-time frame approach ensures adaptability, allowing us to navigate the ever-shifting tides of market dynamics with a nuanced understanding of how chosen levels and signals persist or evolve.
Entry Points – Zigzag or Range Breakouts:
The next step involves choosing entry points, based on—Zigzag and Range Breakouts. This dual-strategy approach grants the flexibility to adapt gracefully to the ever-changing cadence of market conditions.
Zigzag
In the Zigzag strategy, look for clear shifts in the market structure. It’s akin to recognizing when the music changes, prompting a shift in dance style. This strategy involves identifying patterns where the market transitions from higher highs and higher lows to lower highs and lower lows. The Zigzag dance signifies a change in momentum, and we can leverage this shift to enter trades strategically.
Range Breakouts
In the Range Breakout strategy, we enter trades when prices close below or above a key level. This key level acts as the boundary, and once the price breaches this boundary, it signals a potential shift in the market’s performance. This strategy provides a structured and disciplined approach to entering trades.
These dual-entry strategies offer the flexibility needed to navigate various market conditions. In a Zigzag, we capitalize on observable shifts in market sentiment and structure. In a Range Breakout, we rely on the closure of prices below or above key levels, offering a more systematic approach. This flexibility ensures that the trading style remains versatile, adjusting to the rhythm of changing markets.
Risk Management:
The next step is the pivotal crescendo of Risk Management. Managing risks effectively is the art of balancing potential gains with possible losses, ensuring that the overall composition of your trades remains in harmony.
Direct Entry or Pullback Consideration:
Whether we opt for a direct entry into a trade or patiently await a pullback, risk management remains at the forefront of decision-making. This dual approach exemplifies adaptability, allowing you to tailor risk management strategies based on the specific dynamics of each trade.
Weighing Potential Rewards:
Assess every trade, considering not only the risks involved but also ensuring that the potential rewards outweigh the potential downsides. This diligent evaluation acts as a safeguard against significant losses and guides your choice toward trade that aligns with a positive risk-reward ratio.
Protecting Against Losses:
Risk management shields the trading strategy from potential pitfalls. By meticulously calculating the risk associated with each trade, we create a protective barrier against substantial losses, ensuring that the overall trading journey remains harmonious. Whether it’s a direct entry or a strategic pullback, the fundamental principle remains unchanged—protecting capital and optimizing the risk-reward ratio to create a resilient foundation for consistent trading success.
Setting Targets:
The last step unfurls—the delicate art of Setting Targets. We need to strategically plot the destination for each trade, sculpting a conclusion that aligns with the broader narrative of market movements.
Strategic Endpoint Definition:
Imagine crafting the final chapters of a novel with deliberate precision. In the world of trading, conclude each trade with a meticulously defined destination—Setting Targets. These targets aren’t arbitrary; they are strategic endpoints crafted with an understanding of market dynamics and supported by the principles of Fibonacci retracements and key support or resistance levels.
Fibonacci Retracements as Compass:
Think of Fibonacci retracements as a cartographer’s compass guiding the journey. We employ these retracements to map potential areas of interest within the market landscape. By anchoring the target to these key levels, we gain a nuanced understanding of where the price might journey, creating a roadmap for achieving profits.
Considering Higher Time Frames:
In the orchestration of Setting Targets, we consider higher time frames—akin to viewing the entire landscape rather than a singular brushstroke. By understanding the broader movements on weekly or daily charts, we gauge the potential trajectory of the price, allowing for more informed decisions in setting achievable targets.
Informed Exit Decisions:
Targets serve as guideposts, illuminating the path to exit a trade. This involves not only defining these targets based on retracements and key levels but also ensuring that they align with the overarching story told by higher time frames. This ensures that exit decisions are not impulsive but rather rooted in a comprehensive understanding of the evolving market narrative.
Example
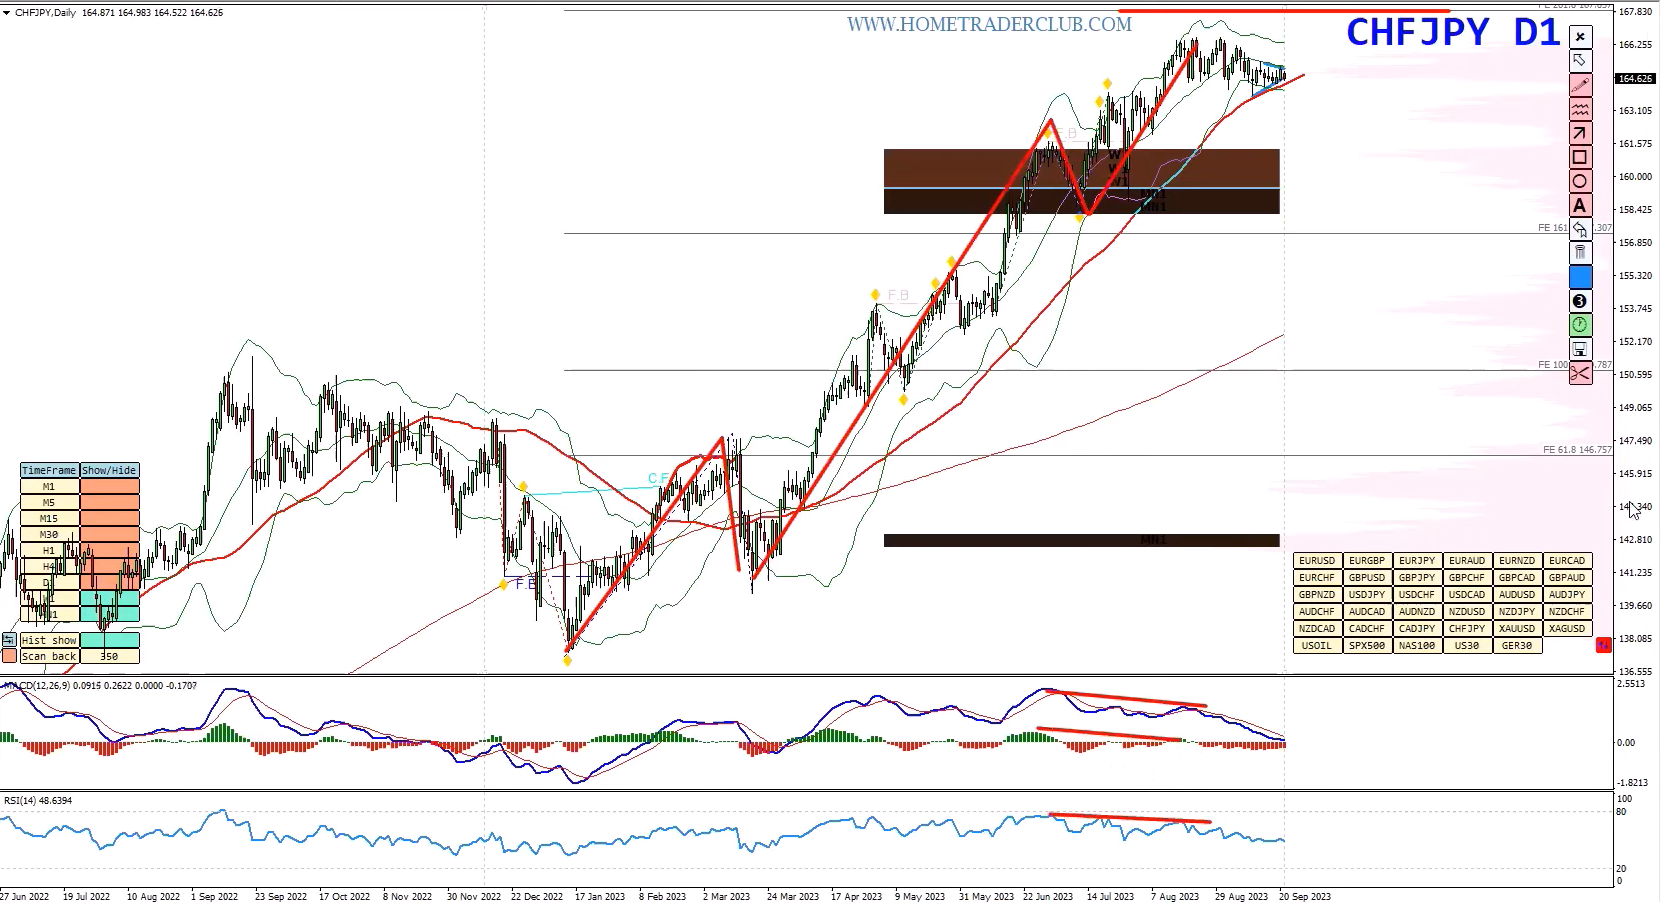
Now, let’s see an example of this strategy in action from one of the trades (CHFJPY Sell) which I shared with my Home Trader Club members.
1. On the daily chart, we have a special cycle and the price has reached a key resistance zone based on the 261.8% Fibonacci expansion level of the first wave of this cycle. In addition to this, we have a bearish divergence based on the MACD moving averages, histogram and RSI indicator.
2. On the weekly chart the price is riding more than 20 candles on the upper Bollinger bands. So I expect a pullback to happen towards the support zones shown in the image below.
3. Going down to the daily chart again and plotting the Fibonacci retracement of the special cycle, we have two target zones. The first target zone would be around the 23.6% Fibonacci retracement zone of the special cycle and the second target zone would be around the 38.2% Fibonacci retracement zone of the special cycle.
4. Moving down to the H4 chart for the entry, we can see that the price has created a zigzag inside a triangle pattern. I want the price to break and close below the bottom of this triangle, this would be the aggressive call. A break below the low shown in the image below (marked in a green dotted line) would be the conservative call here and a pullback would be a good sign for further continuation lower. The invalidation level would be the last high shown in the image below.
5. The next question that you need to ask yourself is whether you will get a good risk-reward ratio with the direct entry here. If the answer is no, then you need to wait for a pullback because a pullback shrinks your stop loss and increases your target.
You can watch the video of this webinar here
Conclusion
This trading strategy is like following a map with clear markers. By identifying key levels, recognizing warning signs, and adapting to different entry strategies, traders can navigate the market more confidently. The emphasis on managing risks and setting realistic profit targets adds a practical and effective layer to this approach.
To your success,
Vladimir Ribakov
Home Trader Club


