Hi Traders! Harmonic patterns are considered as advanced trading patterns, these patterns are not easy to spot and trade but once you know how to analyze and trade them properly it can be very profitable. Harmonic Patterns are the favorite weapon in the trading arsenal of many traders because they work. These are patterns recognized by many different traders which are based on fibonacci levels. All the harmonic patterns are based on fibonacci levels, as you might know the fibonacci is a very important and serious tool which can help us to get a better view of the market.
In today’s article I will explain about the most important and reliable harmonic patterns and how to trade them in the right way.
Gartley Pattern
The first pattern that we are going to see is the Gartley. Generally in my point of view this pattern is less reliable and I use this pattern only for the signals. While trading the Gartley pattern we must combine it with other confirmations like resistances, supports, trend lines, psychological level, etc…
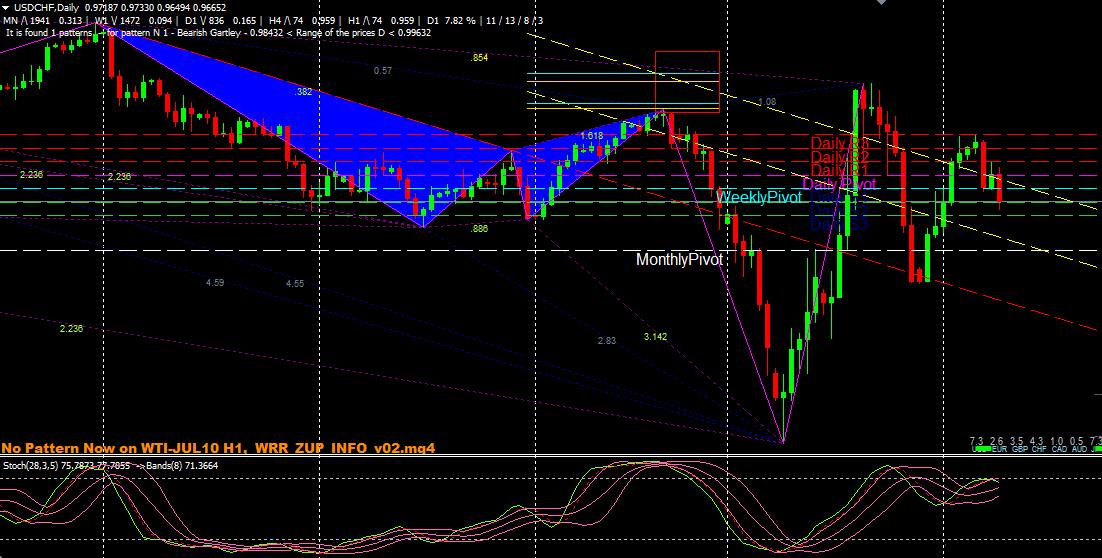
Lets see an example of how the Gartley Pattern looks like, there are two types of Gartley patterns, they are Bearish Gartley and Bullish Gartley.
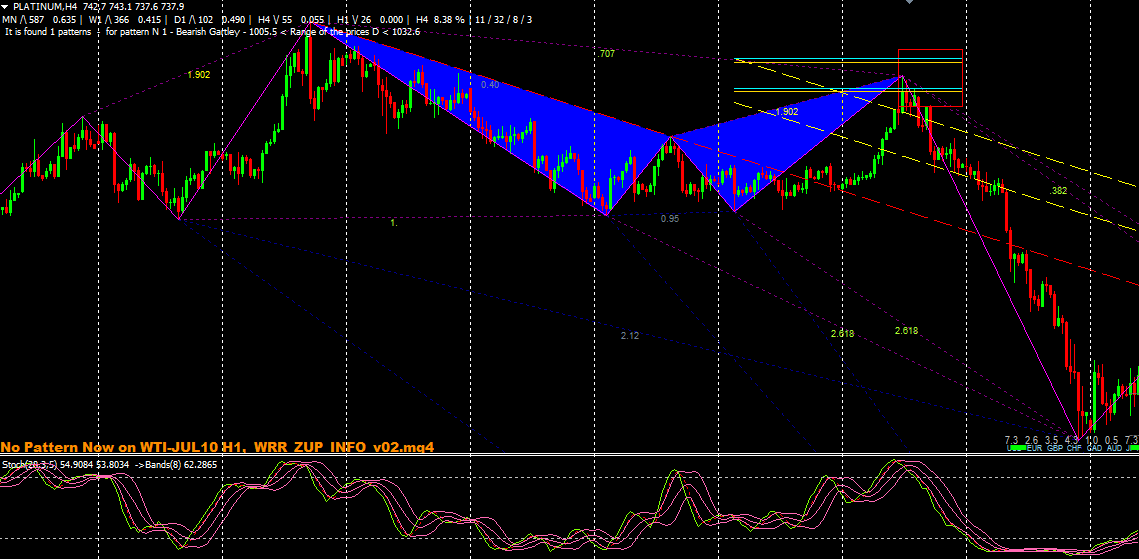
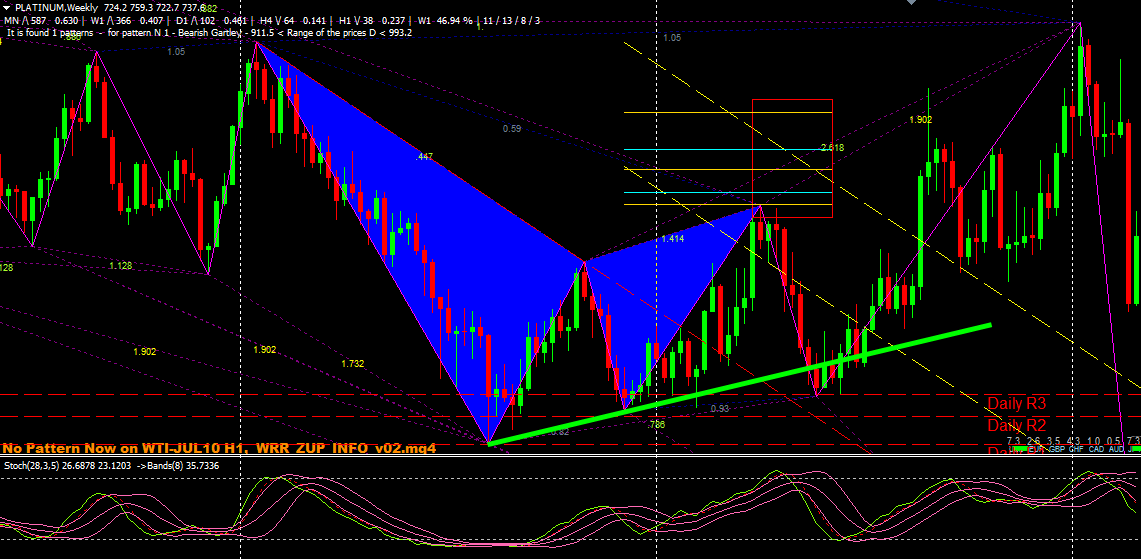
Here is an example of Bearish Gartley Pattern
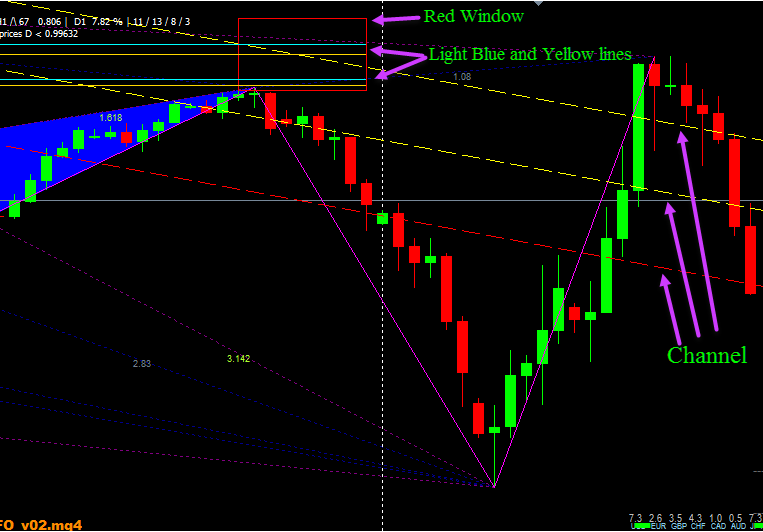
In the above example we got a signal and a red window appeared with barriers (once we get a signal, the red window will appear), we will also get two lines at least one will be in the color of light blue and other one will be in yellow. In addition to this we will also have a channel, this channel is based on fibonacci levels and the prices will usually retrace from one of the channels.
You must remember and understand the fact that the Harmonic pattern is based on statistics, the potential loss is always smaller than the potential profit. So for example we may have many losses in a row but once we have a winner, it covers the losses pretty quickly.
The only thing that is important here is that every risk we take is much lower than the possible profit this is because, I tend to enter the trade somewhere between the two lines (light blue and yellow) shown in the below example and I tend to enter in the red window. Sometimes I tend to enter the trade even if the price is away from the red window, in such cases the price should still be close to the yellow or red lines which is on the channel and also the Stochastic indicator should be on its extreme area (over bought or over sold area depending on the trade direction).
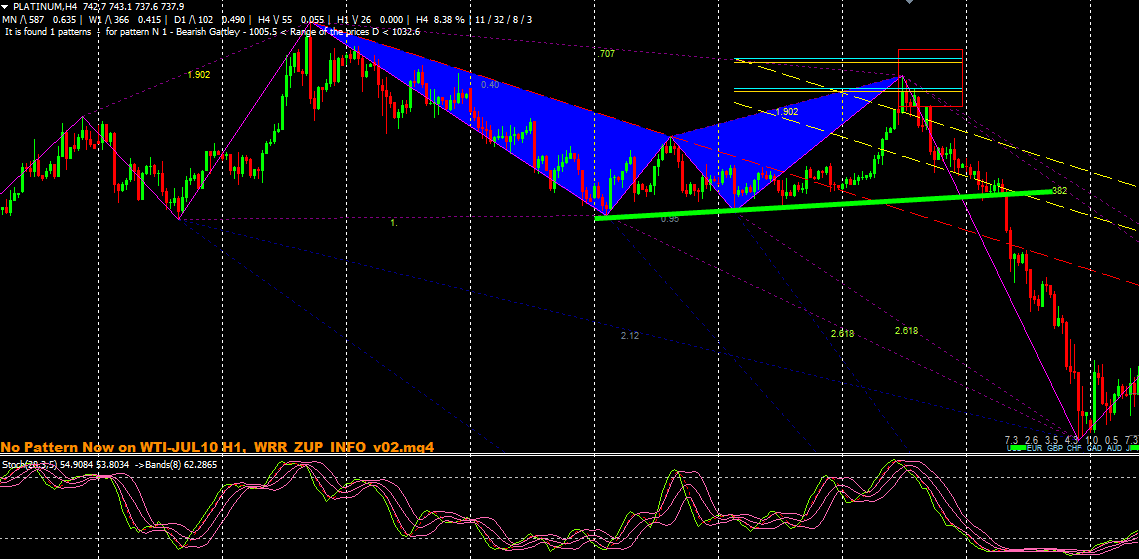
When this happens I am ok with entering the trade even if the price gets out of the red window (The red window and the light blue and yellow lines will be different for each patterns but we should enter on those lines). The stop loss should be placed out of the window depending upon the timeframe you trade (for example if its H4 chart then 10 or 15 pips, if its H1 chart then 5 pips, etc…). I will never enter a trade with a bad risk reward ratio that is when the stop loss is equal or bigger than the take profit. The first profit is placed on the middle point of this pattern. Regarding the second profit measure the pattern from the middle to the end and look for the important support area (here it is a bearish Gartley so we look for important support, if it is a bullish Gartley look for important resistance area) in between this range. For the third target connect the lows as shown in the example below (marked in green line) and this would be the target number 3 for us.
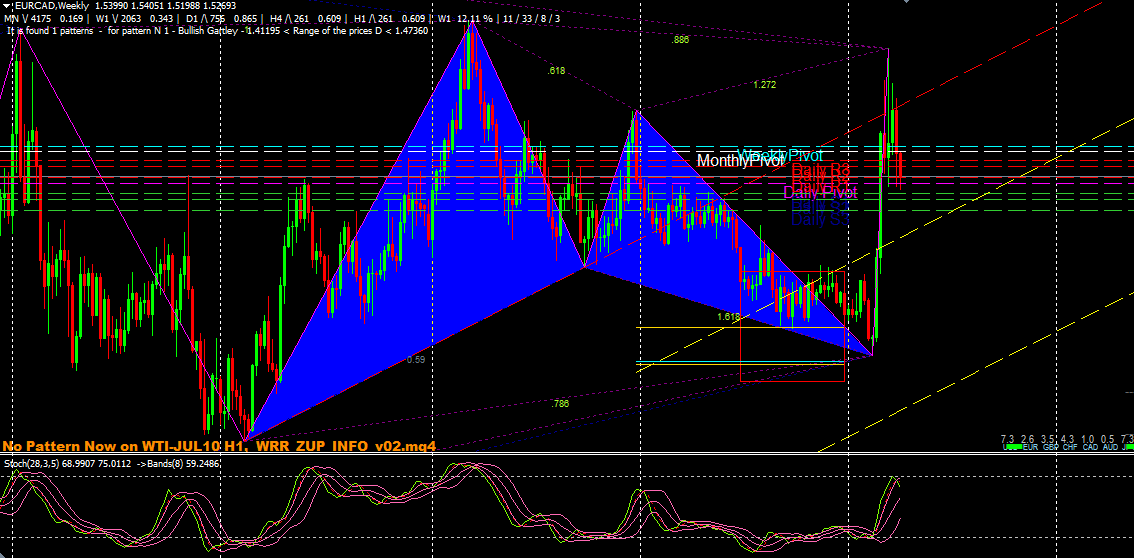
Here is an example of Bullish Gartley Pattern
Extra Notes:
- When the red window meets with channel line then the reliability of the trade becomes much higher.
Here is an example of red window meeting the channel line
- The timeframes that I would like to use this pattern is on the H4 and daily chart, the lowest timeframe that I use this pattern on is the H1 chart. I prefer higher timeframes because you will have enough time to enter the trade.
Butterfly And Bat Pattern
The butterfly and the bat patterns looks alike and these patterns are considered as the most reliable harmonic patterns because of the stop loss and risk reward ratio. The ways to trade these patterns are very similar to that of the Gartley pattern which I explained above.
Butterfly Pattern
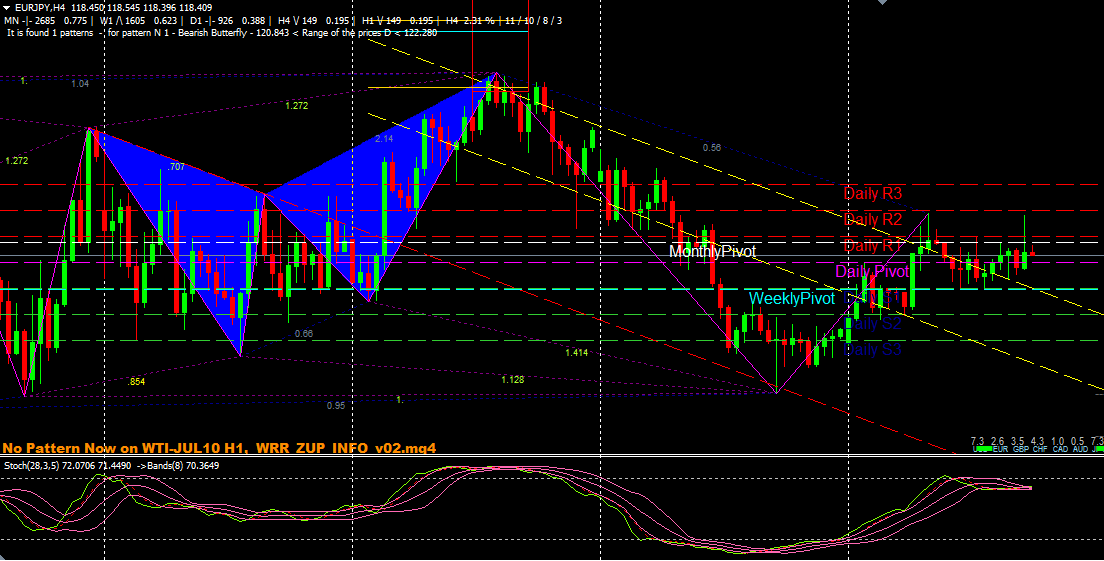
Here is an example of Bearish Butterfly pattern
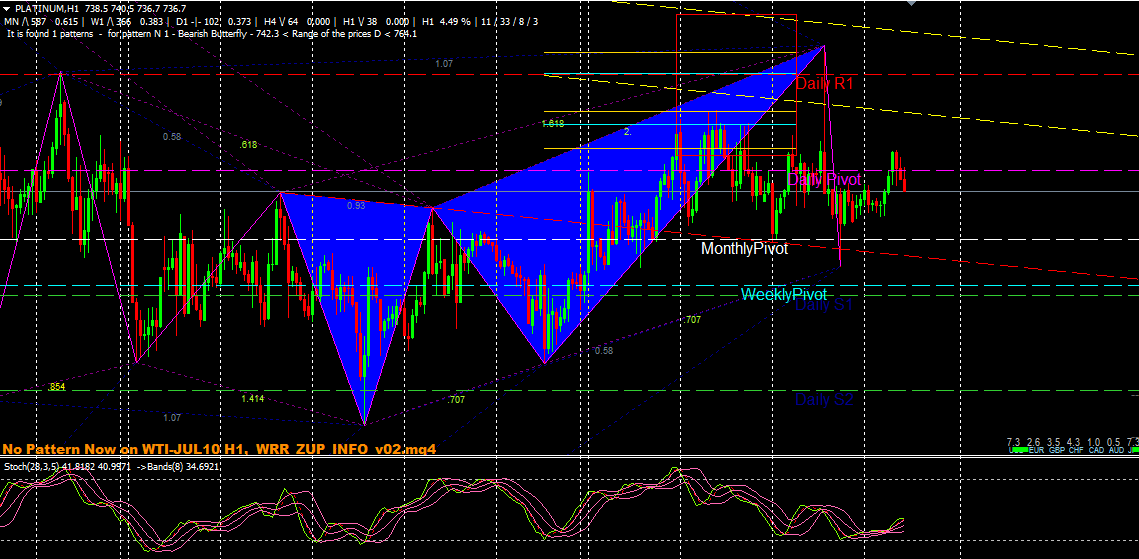
Here is one more example of Bearish Butterfly Pattern
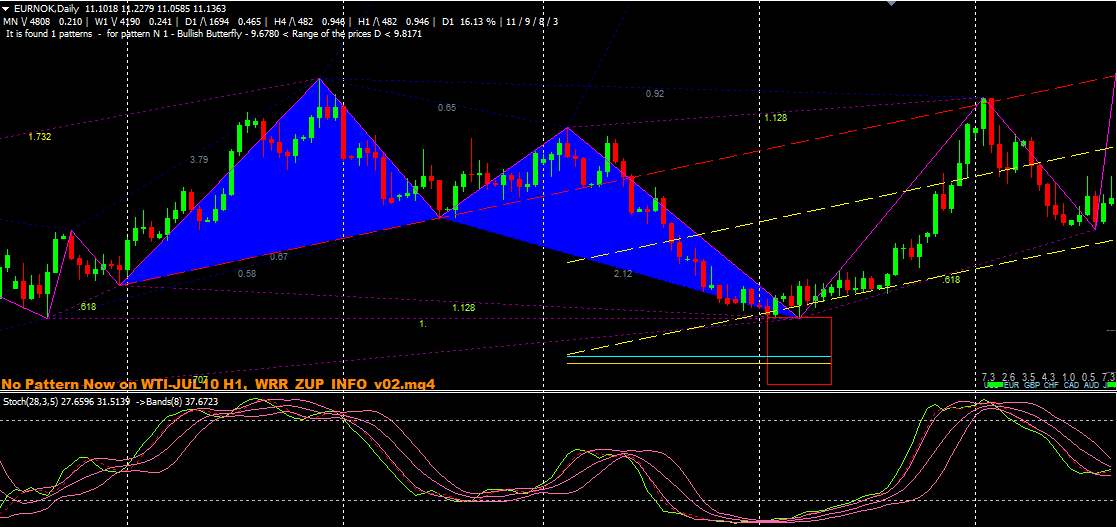
Here is an example of Bullish Butterfly pattern
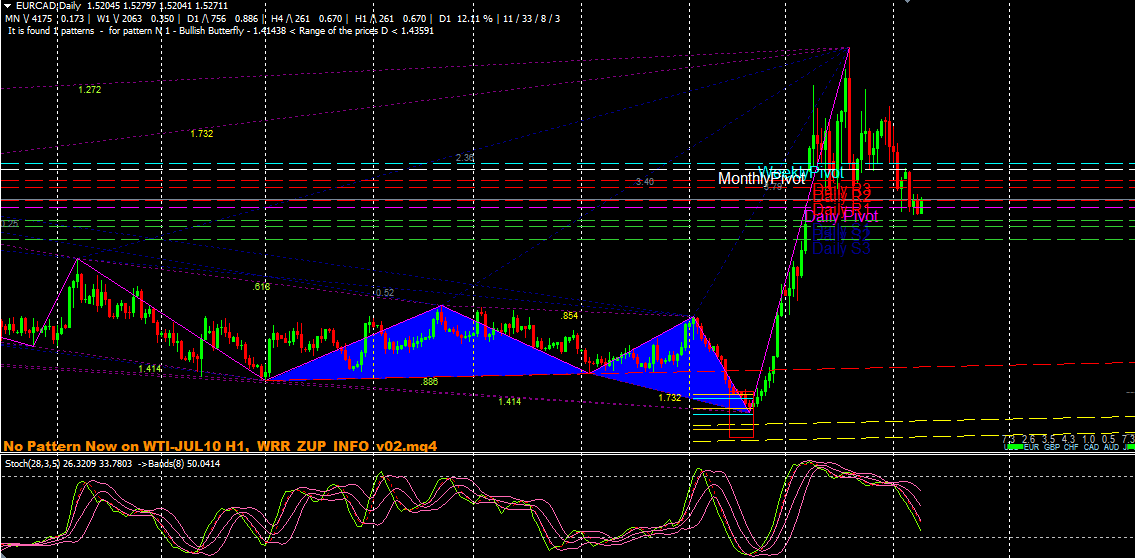
Here is one more example of Bullish Butterfly pattern
Bat Pattern
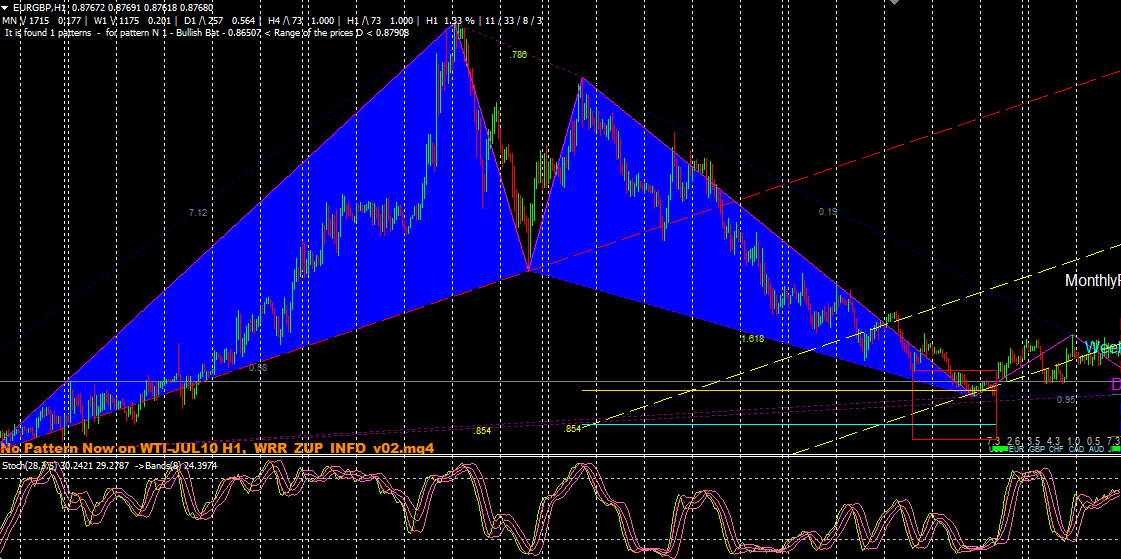
Here is an example of Bullish Bat Pattern
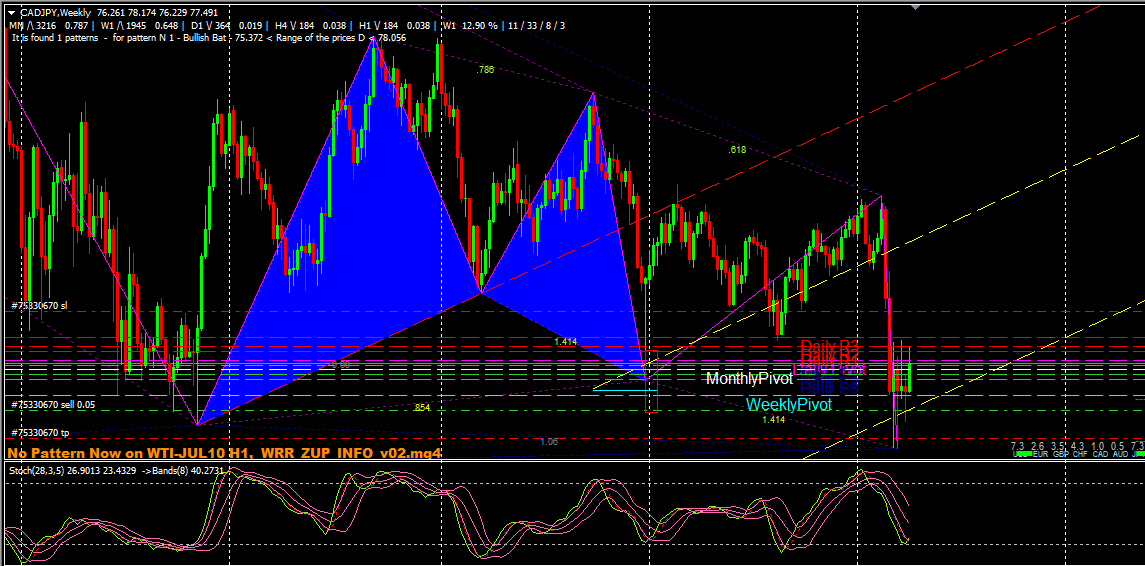
Here is one more example of Bullish Bat Pattern
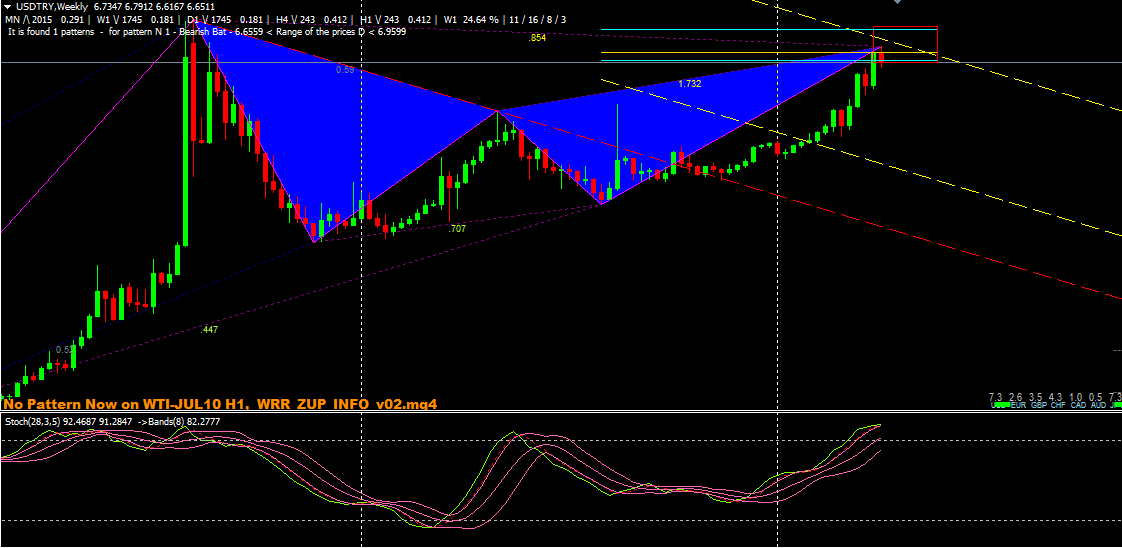
Here is an example of Bearish Bat Pattern
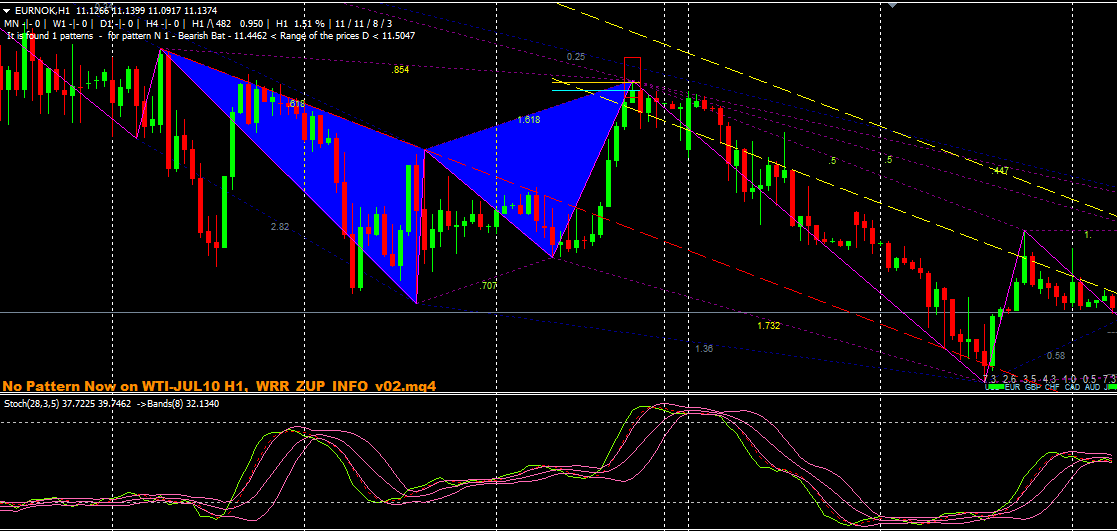
Here is one more example of Bearish Bat Pattern
Crab Pattern
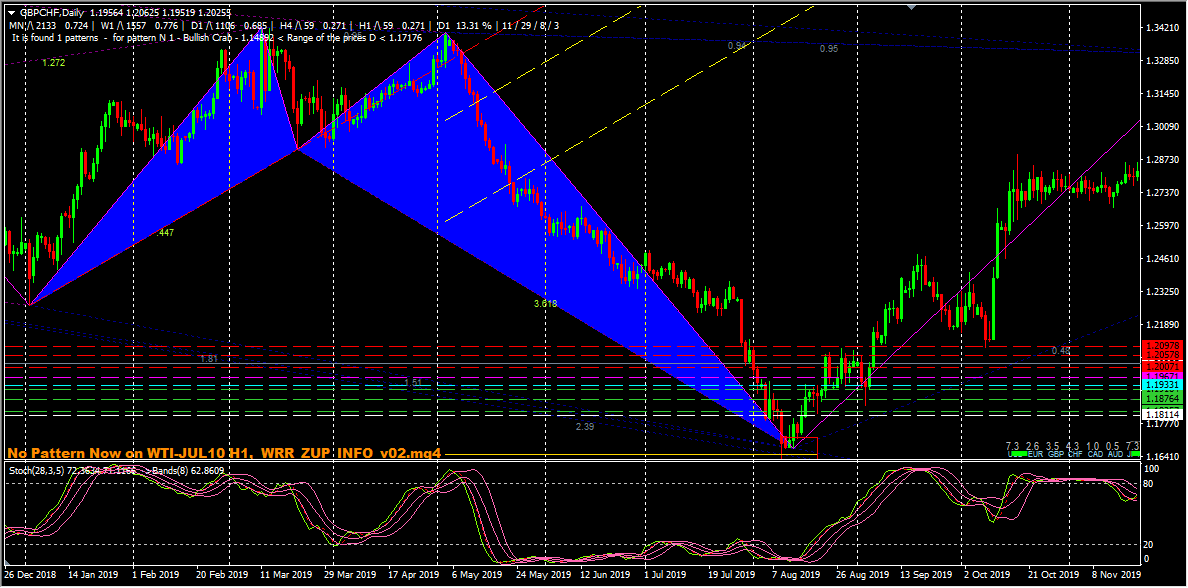
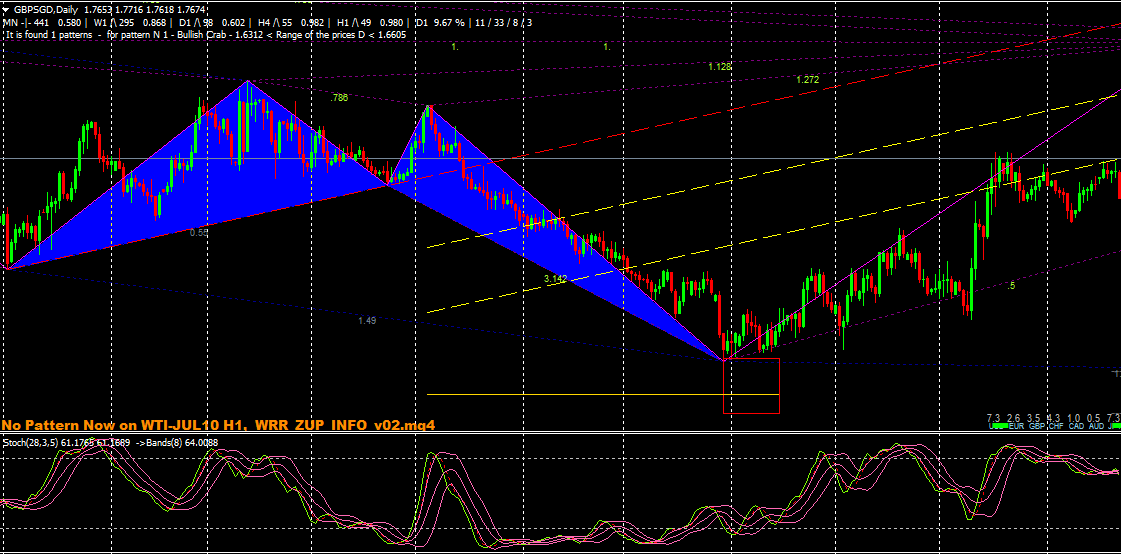
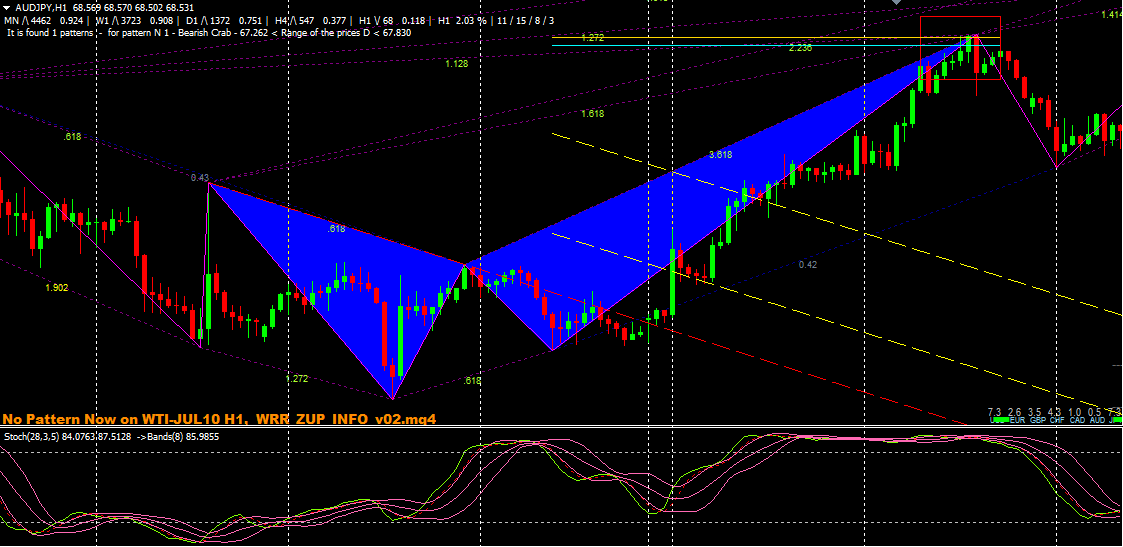
The Crab pattern is the most reliable pattern but this is a very rare pattern and it appears only once in a while. When we have a Crab pattern there are two things that we should remember, the first one is that the stop loss will be very small here so the first target should be placed at the first critical support or resistance area from the entry depending on the direction of the trade. The second thing that is very important to remember is that the Crab pattern will never be on the channel (dashed lines), this is the only harmonic pattern where these dashed lines are not relevant.
Here is an example of Bullish Crab Pattern
Here is one more example of Bullish Crab Pattern
Here is an example of Bearish Crab Pattern
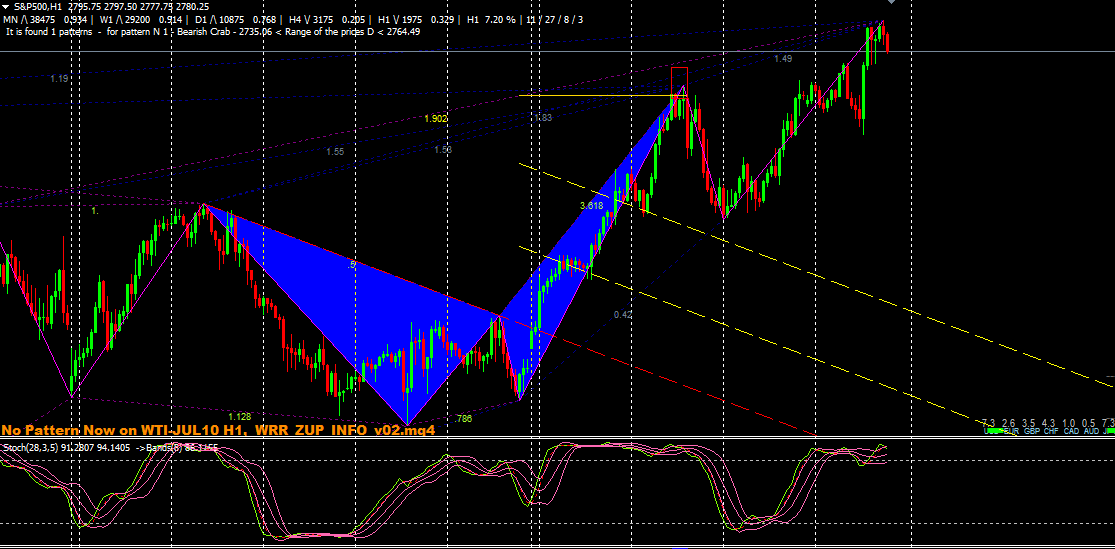
Here is one more example of Bearish Crab Pattern
Extra Notes:
- Generally Harmonic patterns are used at time when there is high volatility and moves in the market.
Stochastic Oscillator
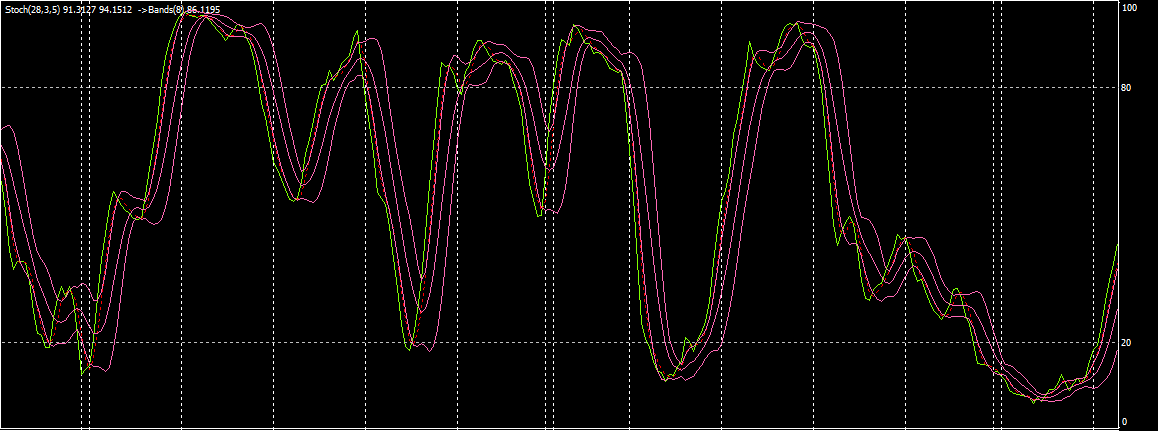
The indicator which we use with the Harmonic pattern is the Stochastic Oscillator (28,3, 5 is used to avoid the noises here, the regular ones which are usually used in Stochastic Oscillator are 5,3,3) and also the Bollinger Bands 8 (not 20) combined together. First of all we have the levels 80 and 20 here, these are critical areas for regular Stochastic Oscillator as well and also we have the Bollinger Bands boundaries.
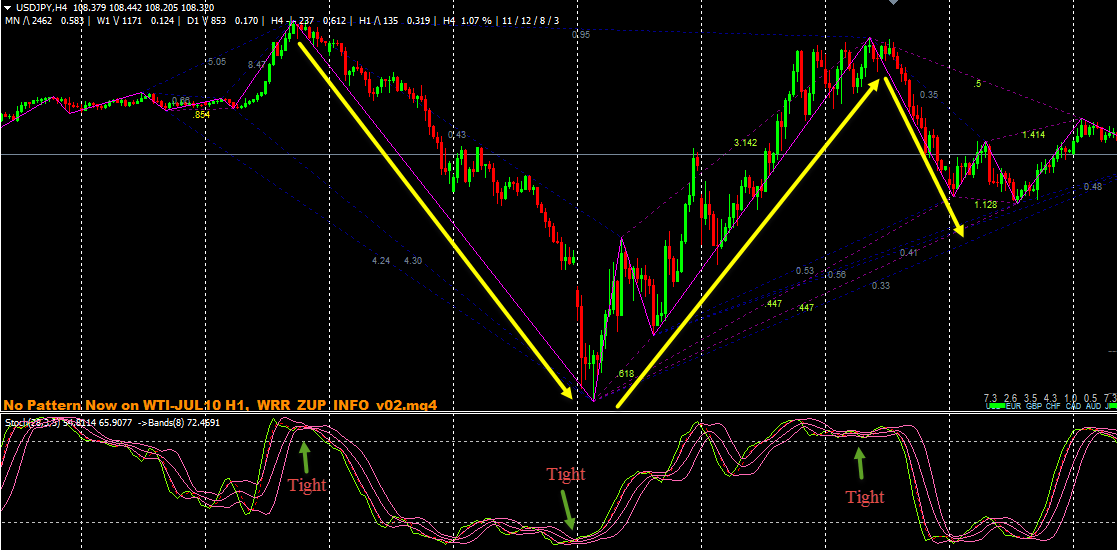
Here is an example of the Stochastic Oscillator which is used with Harmonic Patterns
Check the example below to see what happens when they are really tight, when they begin to be tight even though there is no Harmonic pattern the market will look for a retrace. As long as this indicator continues to move very tight above or below the critical areas the retrace will be powerful and stronger.
So the way to use this indicator is to look for very tight situations, even if there is no harmonic pattern in such situations you can get ready for a powerful retrace of the market.
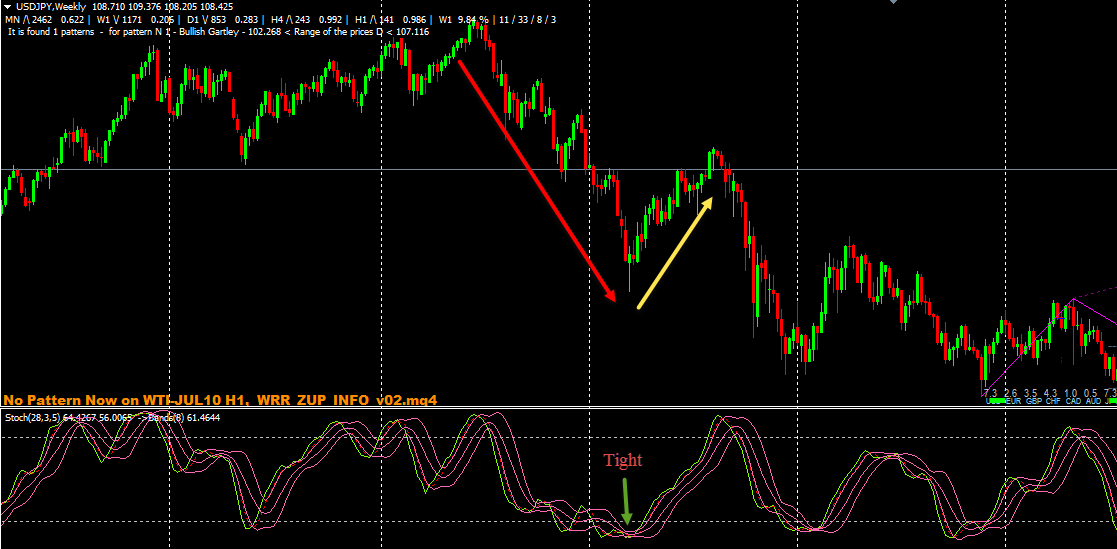
Here is one more example of tight situation in Stochastic Oscillator
As you can see in the above example we had a down move and then we had a tight situation on the Stochastic Oscillator and the market began to correct itself. Most of the times it will not just correct, it will turn the market direction but sometimes as shown in the example above it will just make a correction. In case if you are riding the down move then you should remember that when you see a tight situation then there is a very good possibility that the market will change the direction or at least make a correction and it is a very good place to close 80% of your trade.
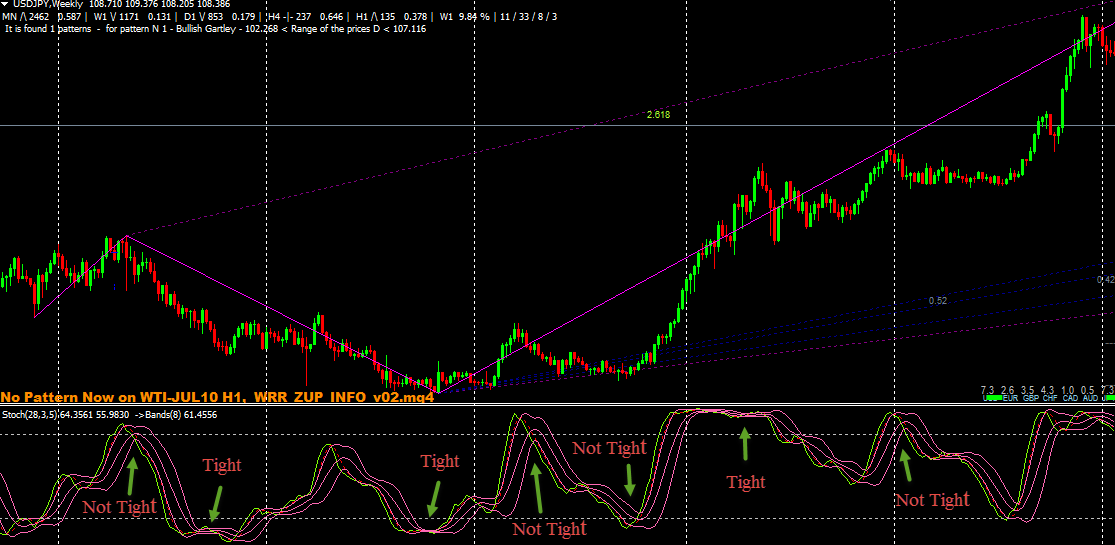
Here are few more examples of tight and not tight situations in Stochastic Oscillator
So traders, this is what I wanted to share with you all regarding how to trade the Harmonic Patterns.
Watch my webinar of How to trade Harmonic Pattern the RIGHT way
I invite you to join me in my live trading rooms, on daily basis, and improve your trading with us.
Also you can get one of my strategies free of charge. You will find all the details here
Thank you for your time reading this article.
To your success,
Vladimir Ribakov
Certified Financial Technician


