Hi Traders! US Session technical analysis April 20th is here. Its time to analyze the changes that occurred in the market and find the good possible setups it has created for us. My analysis of some of the important currency pairs are as follows:
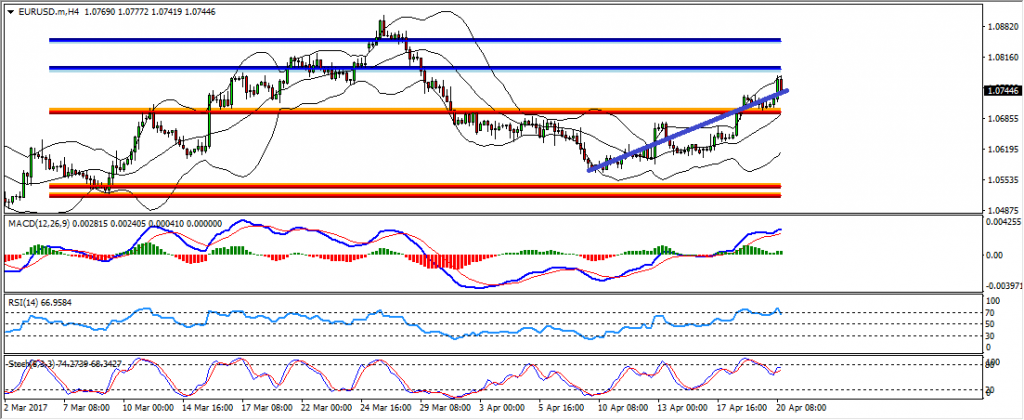
EURUSD H4 Chart:
In this pair the bullish cycle which started last week still continues and the price which was at the 1.069 key level has moved higher with a powerful green bar and currently we have a red bar forming and this looks like a correction that is happening at the moment. We can look for buys near the 1.069 key level.
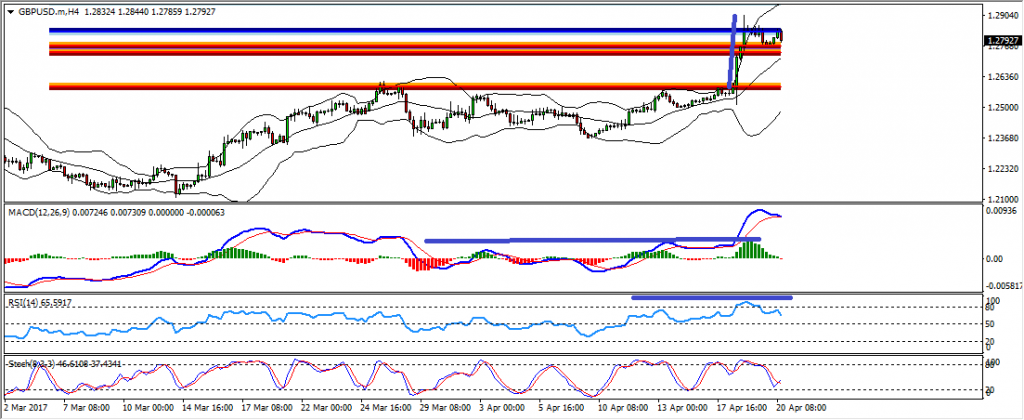
GBPUSD H4 Chart:
We had a extreme divergence in this pair and the price which was at the 1.258 support zone has moved higher and reached the 1.282 resistance zone. Currently it looks like the price is moving inside a range between 1.282 to 1.276. If a breakout happens at the top of this range it will result in the price moving higher above the 1.282 key level. Whereas if a breakout happens at the bottom of the range it might result in a deeper correction.

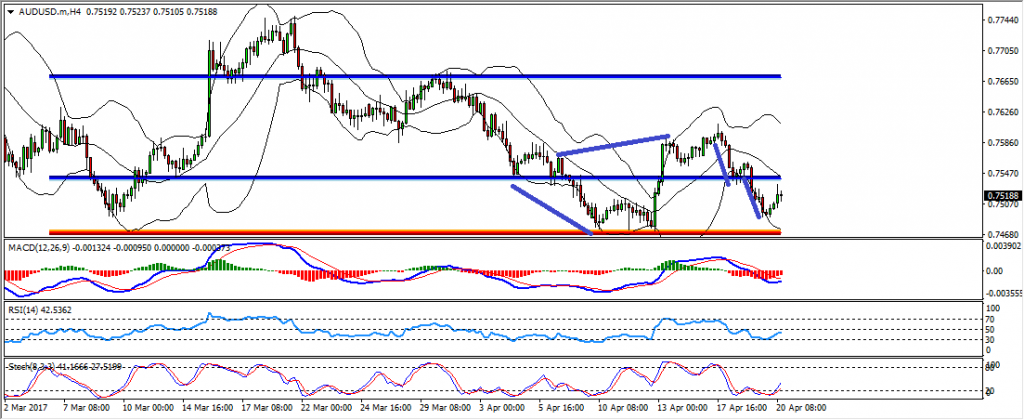
AUDUSD H4 Chart:
In this pair after the bullish divergence and bullish convergence, a double wave correction has happened. Also the bullish hidden divergence which formed earlier has completed itself and the price is moving higher towards the 0.753 resistance zone now. This is good place to look for buys until the last low holds.

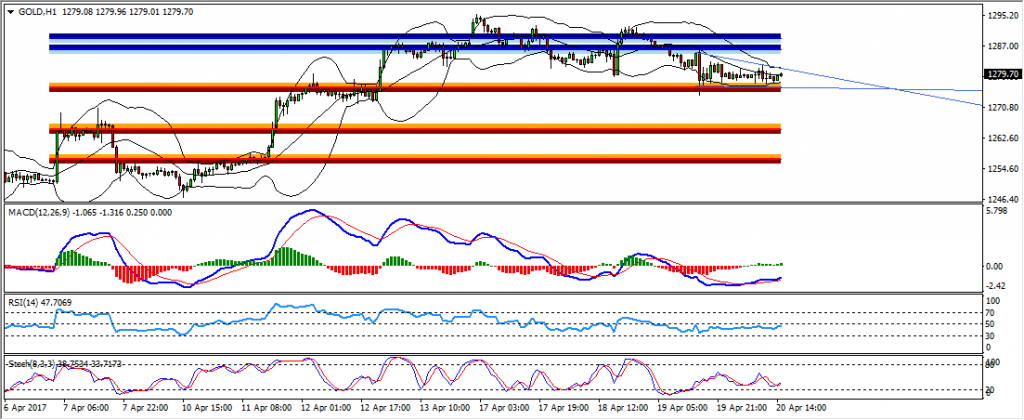
Gold H1 Chart:
The price is moving in a flat range and it looks like a triangle pattern is forming at the moment. If a breakout happens at the top of this pattern we may expect the price to move higher and reach the 1285 resistance zone whereas if a breakout happens at the bottom of this range we may expect the price to move lower and reach the 1264 support zone.

You can get more trade ideas by joining my club for free now. You can enroll today using our Broker Sponsorship project here:
You can also get one of my strategies free of charge using the same Sponsorship project.
Yours,
Vladimir


Good analysis. Keep it up
Thanks a lot, very useful