BTCUSD bears seem to remain on a battleground against bulls, with regular shifts in dynamics structuring an interesting pattern.
The pair looks set for more upside should one follow its last leg from the 31k barrier. However, judging from the triangular structure that is reinforced by price action over the short-to-medium term, the market could tumble.
BTCUSD Barrier Triangle Set to Complete
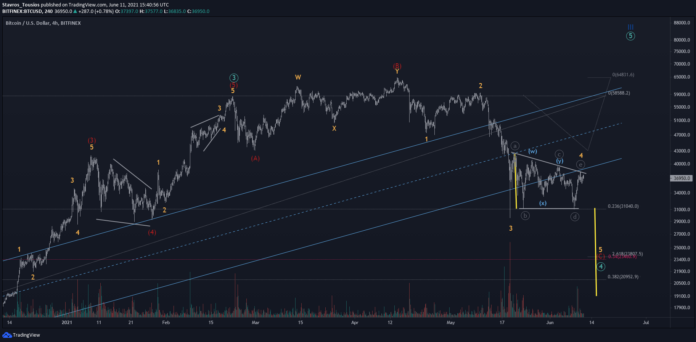
In my main scenario, a bearish impulse is expected to keep buyers on their toes until prices perk up again. The 5-wave move is part of an extended wave (C) of an (A)(B)(C) expanding flat in wave ④.
With waves 123 and likely 4 having been completed, the final wave 5 is expected to finalise the irregular flat variation.
Typically, when triangles are seen in waves 4, the price range between the opening sides of the triangle makes a good indicator for a target for wave 5 when placed at the breakout point. This could bring us down to ~$19K, should we get past the ~23K and ~21K supports; the 2.618% extension of waves (A)(B), and 34% retracement of the running wave III (as projected by using the 66% correction in wave ②), respectively.
What Signs Should You Look For?
The main scenario could get invalidated once the 39500 gives in to bullish pressure as wave ⓔ of a triangle can never move past wave ⓒ.
In such a case, the likelihood of more upside will increase, and we may see two alternatives coming into play should we get no fresh low.
One – wave (C) ended at the local low of 29500, and we can see bulls re-accumulating to fresh highs; Two – wave 4 is incomplete and likely to turn into a wxy complex correction.
New Low Failure Opens Room to Further Downside
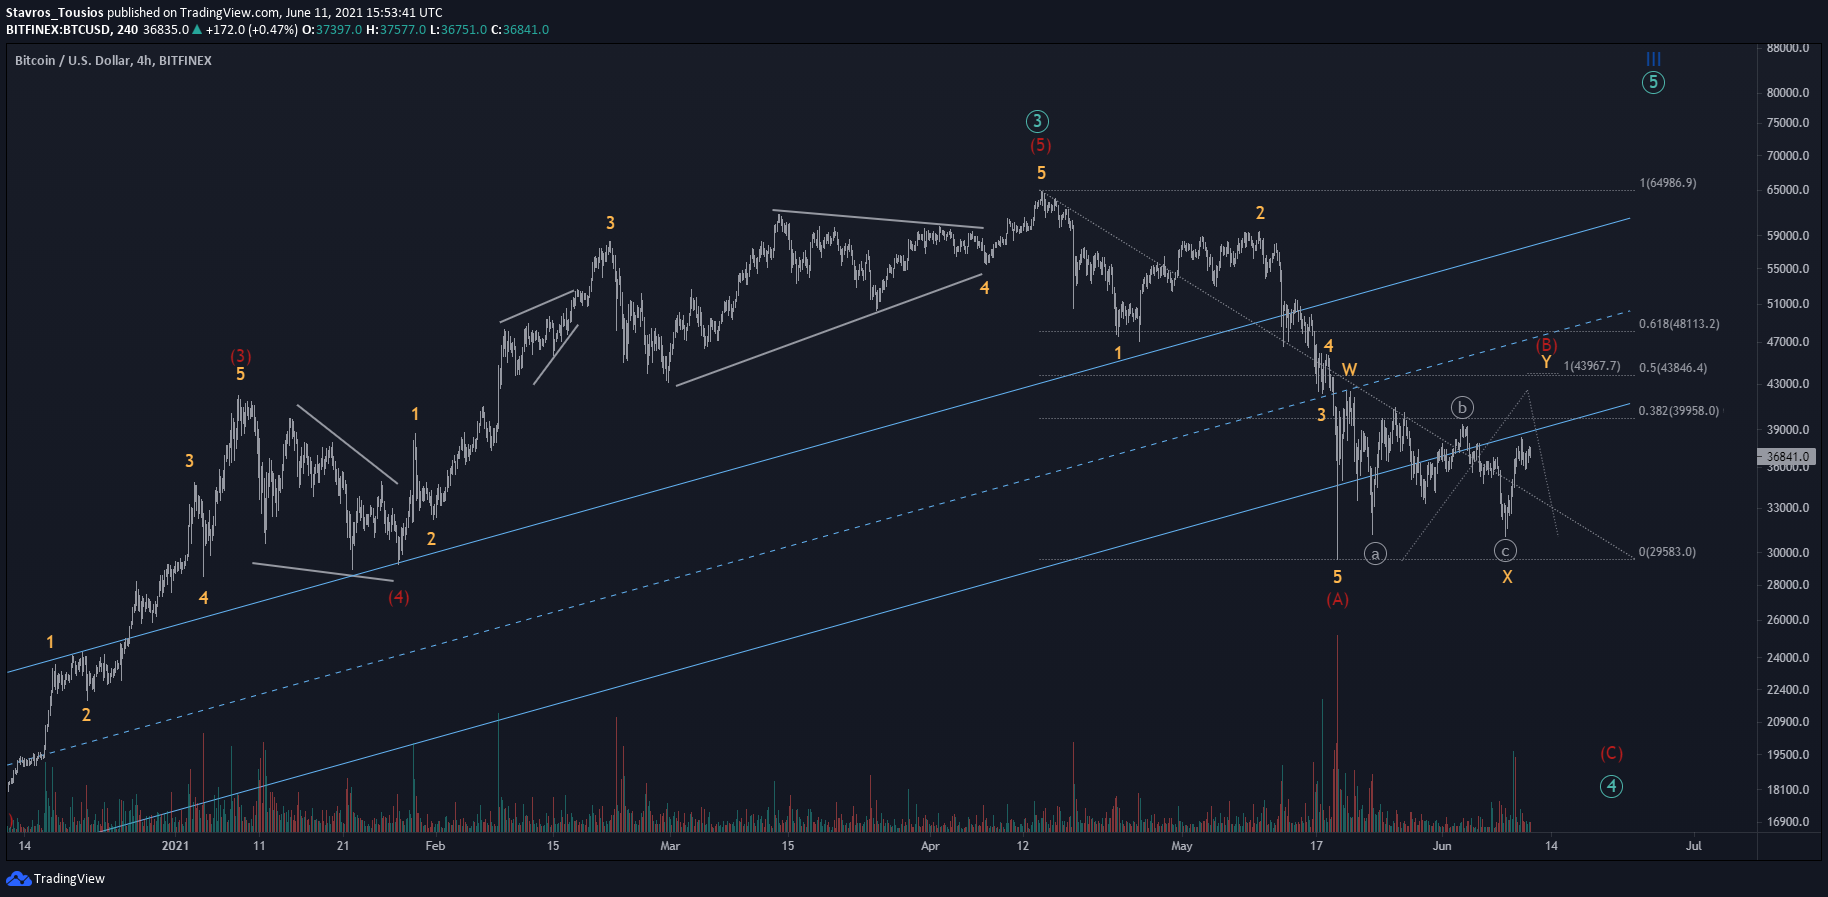 In my alternative scenario, we can expect a fresh low and a deeper drop than 19k as part of a simple zigzag in wave ④. The dip could get us to ~16K as this is the 78.6% extension between wave (A) and a projected wave (B) at ~44K
However, there are more than one scenarios this could take place. We could expect wave (A) to either end in a 5-wave move or that it has already ended, which is the higher probability alternative scenario.
In the former case, we can follow a similar approach to the main scenario. But we can expect a marginal decline if the triangle pattern plays out as bulls will be more inclined to correct in wave (B) relatively fast and end the longer-term zigzag correction in wave (C) lower down.
In the latter case, we can expect the bullish leg off the 31K lows to continue in a 5-wave impulse move and end with another 5-wave move higher up as a complex zigzag in wave Y of (B). Should we see a break above the 39500, then the run to 44K could be an easy one as it forms a nice cluster between the 100% extension of waveswx and the 50% retracement of wave (A).
About the Author
 Stavros is an licensed Forex professional, currently heading the investment research team at a reputable broker. He has demonstrated history in proprietary trading, Elliott Wave analysis and educational content writing. He is seen writing in the best sites for traders.
You can follow Stavros on Twitter and Linkedin here: twitter.com/StavrosTousios & linkedin.com/in/stavrostousios/

