Hi Traders! Harmonic patterns are one of the favorite trading techniques among traders. And they have a good reason for that. Harmonic patterns are fully based on Fibonacci levels and that’s a powerful and reliable trading technique.
However, to make it reliable and useful, you need to understand that like any other trading technique or trading strategies, it’s not about just clicking sell or buy. You need to understand what is the logic behind the strategy, it’s cons, and its pros.
Like any other forex strategy, it, first of all, relies on the price/ the chart. Meaning, you need to understand what happens on the chart and is your buy\sell opportunity that is found by the harmonic patterns, has good chances to end up as a winner, or not.
In this article, I will share with you my way to trade the Harmonic Gartley Pattern with the highest accuracy level.
Gartley Harmonic Pattern
As you can see in the screenshot below the Harmonic Gartley pattern was found on the H4 chart and we marked a critical zone below (marked in pink). At the moment this zone comes into play the most important thing that we need to do is to apply the technical analysis.
Note: You can learn more about the Harmonic Gartley Pattern in my free e-book here
Why Technical Analysis Has To Be Applied Here?
By applying technical analysis you basically analyze the current market conditions and you see if the buy or sell that you found with the harmonic pattern has high probability to succeed, or not. In simple words – in a clear bullish trend you don’t want to rush and sell and in a clear bearish market you don’t want to rush and buys. Joining the trend has always higher chances for you.
Technical analysis helps you to analyze the “big picture” and find clear trends, strong levels, and high probability trading opportunities.
How To Apply The Technical Analysis?
There are many ways to analyze a chart. I personally love to analyze the chart in a specific way that helps me find great trading levels or areas. In order to help you understand this, I’ll take an example from one of the trade’s which was traded inside my Traders Academy Club. (EURAUD in the bullish direction).
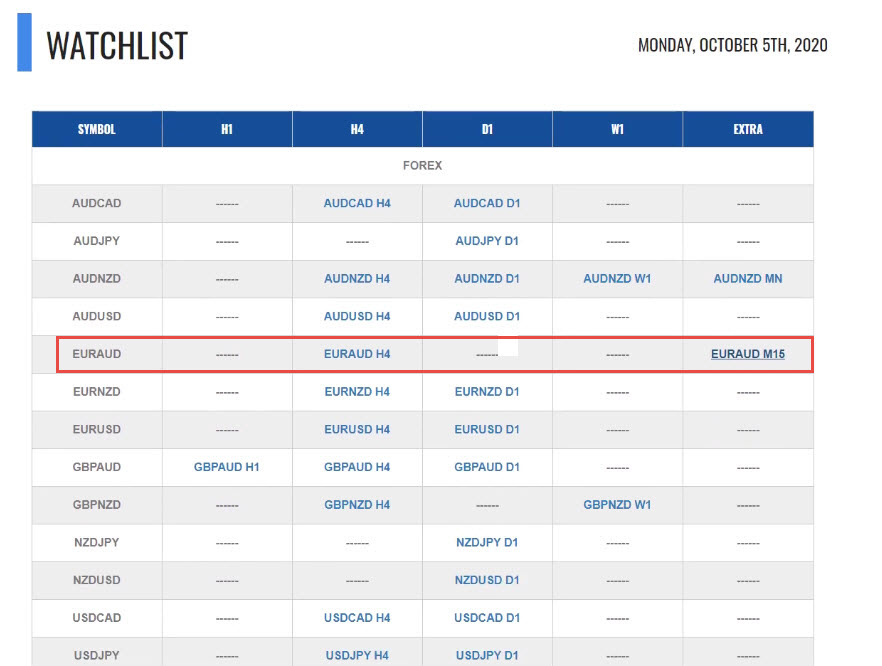
On the table below you can see my trading watch list. This list is all the trading opportunities I share with my followers on daily basis, in Traders Academy Club (Join us here).
Let’s start our technical analysis from the H4 chart as we found the Harmonic Gartley pattern in the H4 timeframe. Looking at the H4 chart, I found a few legs as shown in the screenshot below in one direction (downwards). And we could see that the price is facing a key support zone and from this zone instantly I am looking to see if I have any bullish signs on the indicators.
 On the histogram and the moving averages of the MACD indicator, we can see that we have a clear bullish divergence.
Note: If you want to learn more in-depth insights about divergences, you can benefit greatly from the videos on my channel here while also embarking upon Divergence University for comprehensive divergence education.
This is a great sign and from this moment there is a very high probability for the price to bounce higher.
The next step I do is, I move down to a lower timeframe (H1 or M15) and I look for a trending pattern. Looking at the M15 chart we could see that the price has created three higher highs, higher lows which is a clear representation of the bullish trend pattern.
Why am I Looking For Higher Highs, Higher Lows?
This is because in bullish condition or in the bullish market the buyers manage to create higher highs, higher lows, it represents the bullish power and shows the buyers are in control.
Note: If you want to learn about price action trading, you can find it here
So after we spot this, I look for pullbacks to increase my opportunity to make the risk-reward ratio better and then further continuation higher.
The pullback that I was looking for happened and then I apply the same bullish divergence idea here as well. This time we have the bullish divergence on both the MACD and the RSI indicator as you can see in the screenshot below.
The best part here is that this bullish divergence comes after a bullish trending pattern where we have more than three higher highs, higher lows. Also, the price which was moving higher has broken above a resistance zone which has now turned into a support zone, and later on it became a clearance zone where a lot of stop losses were hunted (as you can see in the screenshot below the price cleaned the stop losses with a spike and completed a bullish divergence).
Also, we have the dynamic 200 moving averages which act as dynamic support here.
Basically all this comes together to one big clean phase, the Harmonic Gartley pattern in the bullish direction, Bullish top-down multi-timeframe analysis, trending pattern is in our favor as well. This means from this moment I decide to go with the buy trade and normally the move would deliver here a risk-reward ratio which will be bigger than 1:1.
(Note: In trading philosophy, anything in positive risk-reward works in your favor because when you start a random trade you have a 50:50 chance to be right or wrong without analyzing anything. When you apply the analysis this number increases because you are working with proven technical tools. And when you put the risk-reward in your favor in higher statistical number and chances to be right then you got yourself a fantastic trading strategy).
Conclusion
As you can see, my goal is very simple – find as many bullish facts as possible on the charts in order to trade the Harmonic Gartley Pattern with the highest accuracy level. To do so, I do multi time frame analysis and making sure I have the basic facts\evidences that support my bullish view (In this case bullish, as the harmonic signals was for buys).
Frankly, Harmonic pattern is not my default trading style, especially for the short term. I love to see the patterns developing in the direction that I am looking to trade. I am not one of those traders who enter a trade blindly after a harmonic pattern, I love to apply the analysis and I wanted to show you how I apply my type of analysis inside it and explain the logic behind it to you.
Watch the webinar of How To Trade “Gartley” Harmonic Pattern With The Highest Accuracy Level
I invite you to join me in my club and enjoy from our Live Market Analysis and our trading reports on a daily basis and improve your trading with us.
Also, you can get one of my strategies free of charge. You will find all the details here
Thank you for your time in reading this article.
Yours to success,
Vladimir Ribakov
Certified Financial Technician


