Hi Traders! CADJPY technical analysis based on our In House Indicators is here. In this post, we are going to perform the technical analysis in CADJPY using the Key Trading Levels Indicator and False Break And Convergence Indicator. We do our analysis on the MetaTrader4 platform (MT4), some very interesting, useful tips and hacks about the MT4 platform could be found here. If you would like to learn more about the way we trade and the technical analysis we use then check out Traders Academy Club Spoiler alert – free memberships are available!
CADJPY W1(Weekly) Chart Analysis Based On FBCI AND KTLI
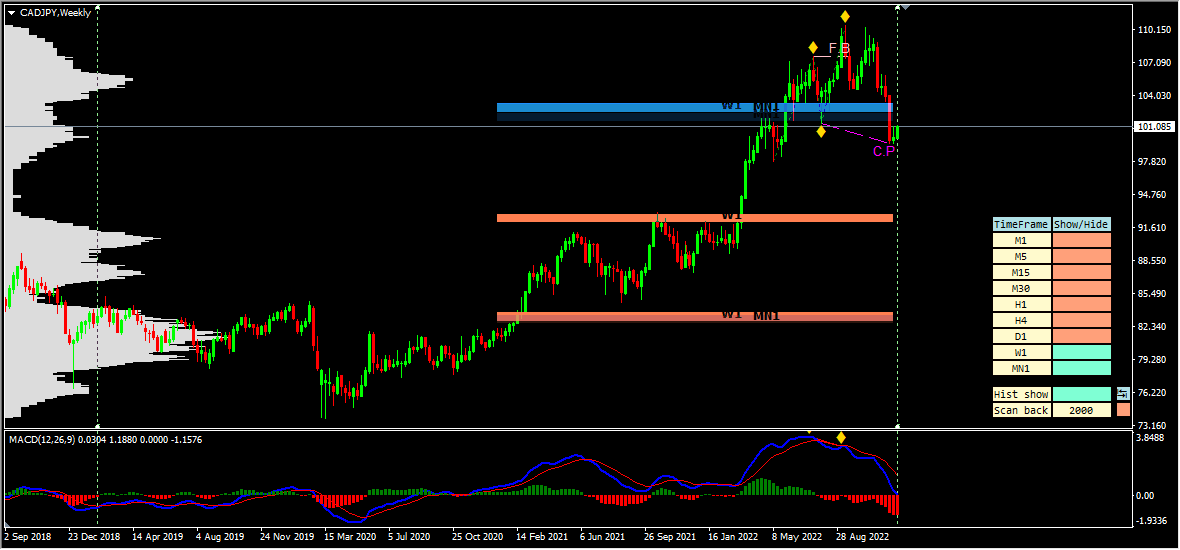
On the weekly chart, using the False break and convergence indicator, we could see that the price has created a false break which is a sign of slow down. In addition to this, the price has also created a bearish divergence between the first high formed at 107.210 and the second high which has formed at 110.523 based on our MACD indicator.
Note: You can get the MACD indicator Here
The price then moved lower and created a partial convergence, we may consider these as signs favouring the bears. You can see this false break and partial convergence indicated by the FBC indicator in the image below.
Note: You can get the False Break And Convergence Indicator Here
Now based on the Key Trading Levels indicator we could see that the price which was moving lower has broken below a key support zone (which has now turned into a key resistance zone after the breakout) based on our volume profile Key Trading Levels Indicator. We may consider this as a sign favouring the bears. Now combining both the KTL and FBC indicators together we can see that the market has provided various facts supporting the bears.
Note: You can get the Key Trading Levels Indicator Here
CADJPY D1 (Daily) Chart Analysis Based On KTLI
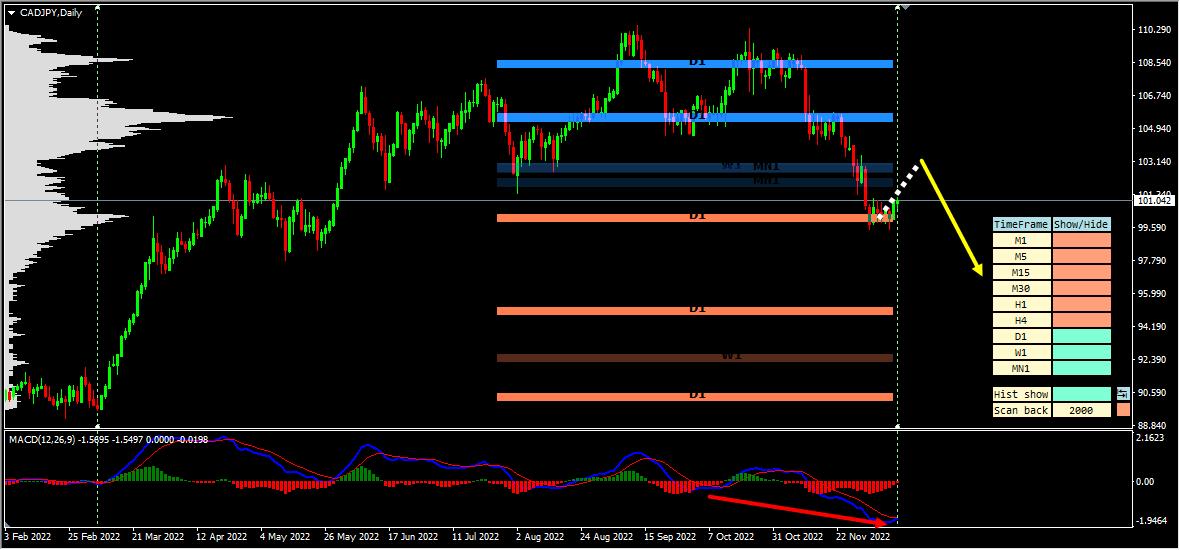
Looking at the daily chart, based on the KTL indicator, we could see that the price which was moving lower was blocked by a daily support zone. The price respected this zone and is currently moving higher from it. Generally, after a bearish convergence, as per the book, we may expect pullbacks and then a further continuation lower. So, after the weekly bearish convergence currently, it looks like a pullback is happening on the daily chart. So until the two key resistance zones based on our KTL indicator (marked in blue) shown in the image below hold my view remains bearish here and I expect the price to move lower further after pullbacks.
Download our best indicators here here
Join our trading family and enjoy all our REAL-TIME trading opportunities and REAL-TIME trading education!
You will also find a pretty extensive database of educational materials here in the blog – just use the search or check out the Forex Education section above.
If you have any further questions, don’t hesitate to drop a comment below!
Happy Trading!
Arvinth Akash
Traders Academy Club Team


