Hi Traders! Bitcoin technical analysis is here. As we do in every technical analysis post we are going to perform the multi-time frame analysis on Bitcoin. We do our analysis on the MetaTrader4 platform (MT4). Some very interesting and useful tips and hacks about the MT4 platform could be found here. As usual, we will start our analysis from the highest timeframe which will be the weekly chart here.
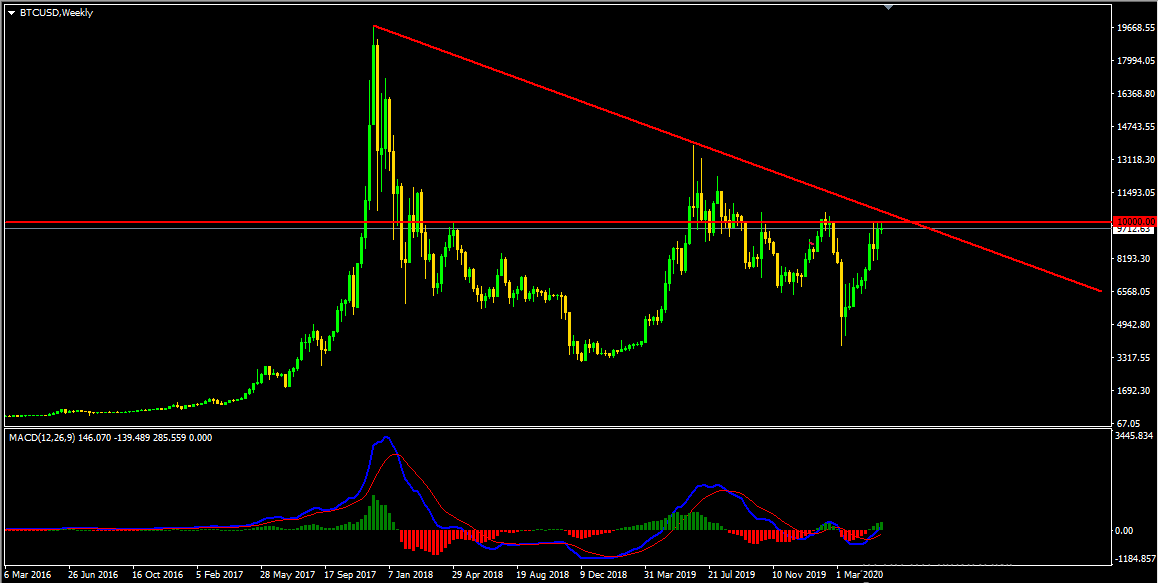
Bitcoin W1(Weekly) Chart Analysis – Downtrend Line, Psychological Level
On the weekly chart, we have a good downtrend line that has formed and the price is respecting it so far. The price which is moving higher is currently nearing this downtrend line and in addition to that, this dynamic resistance also coincides with the psychological level 10,000 which makes this area a strong resistance zone for us.
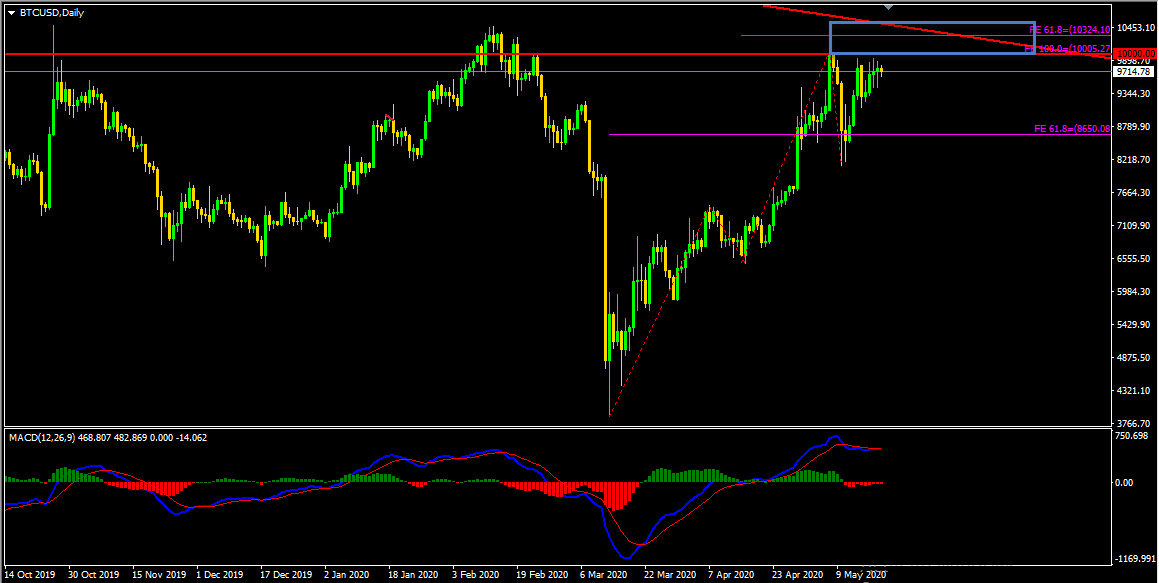
Bitcoin D1(Daily) Chart Analysis – Very Strong Resistance Zone
Looking at the daily chart we could see that the price which is moving higher has created two waves to the upside. While measuring these two waves using the fibonacci expansion tool, we could see that the 100% fibonacci expansion level of the first wave at 10005.27 and the 61.8% fibonacci expansion level of the second wave at 10324.10 coincides with the weekly resistance zone, which makes this area a very strong resistance zone for us. We may expect some serious fight between the bulls and the bears around this resistance zone. In case if you are involved in the buys then this resistance zone is a very important place to consider and manage your trade (cash out or partial cash out or trailing protections or partial hedge, etc.. depending on the strategy that you work with).
Note: If you want to learn about Money Management you can find it here
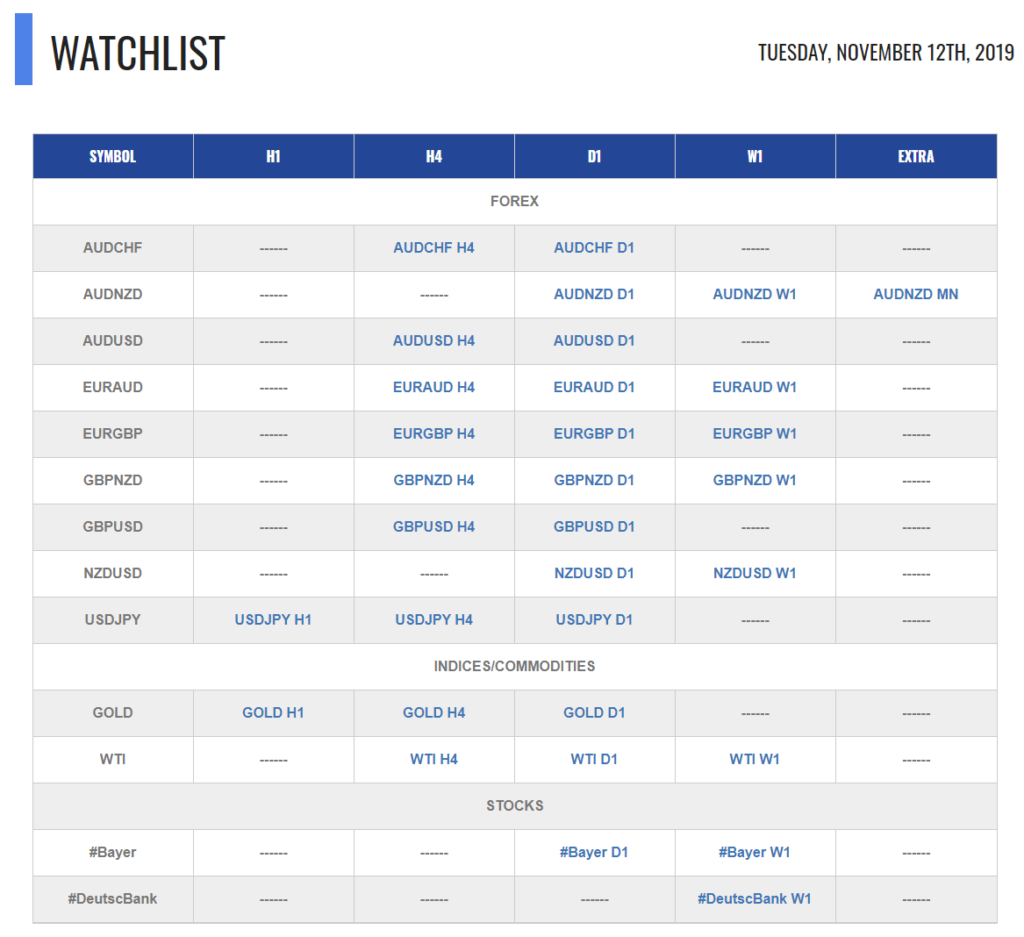
For similar trade ideas and much more join the Traders Academy Club and get access to our complete watch list and trade report.
This is how the report looks like. A table with the hottest market opportunities, screenshot behind every pair and time frame (anything that is in blue inside the table is clickable and leads to a screenshot) + a summary in text format, kind of highlights. And of course Live Trading Room every single day.
If you have any further questions, don’t hesitate to drop a comment below!
To your success,
Vladimir Ribakov
Certified Financial Technician


