


In the first part we have covered the basics of the Bollinger Bands indicator. This article will be focused on Bollinger Bands strategies and ways to trade it. You can use the information as it is and play with it to see what works for you and your trading style or implement it in a different way so that it fits your needs. There are literally tens of ways to apply the methods described below. You can use multiple time frame confirmations, financial instrument correlations and so on..
Bollinger Bands Strategies
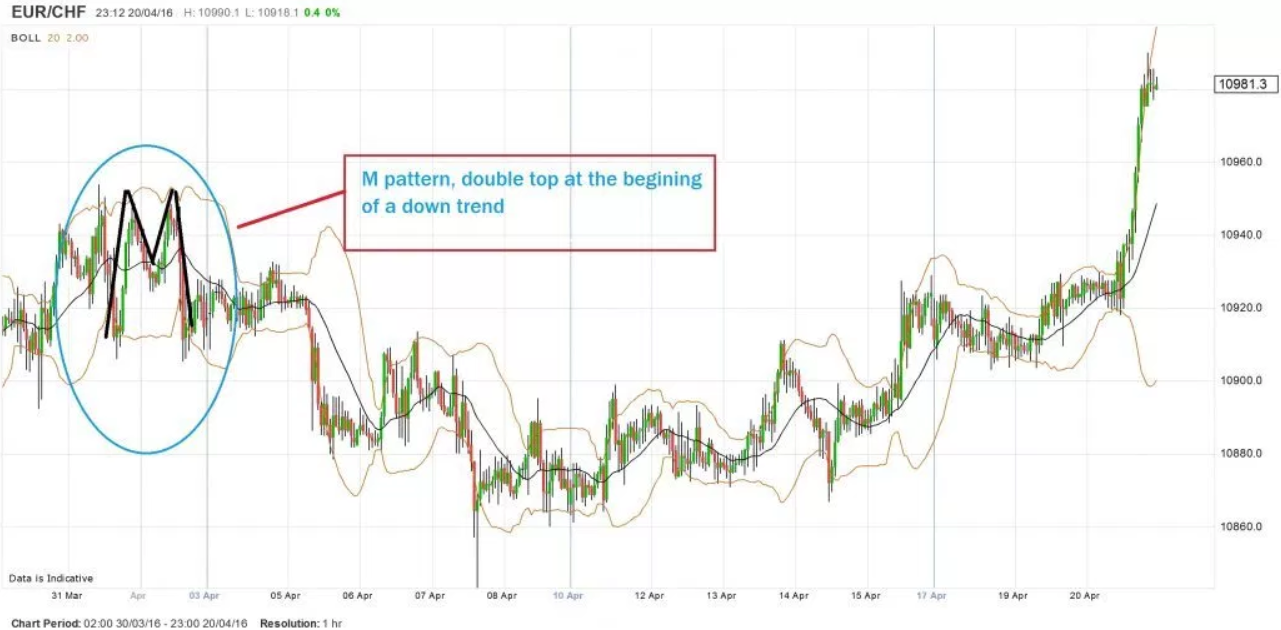
Double top formation:
The M pattern is commonly known as the double top, using a Bollinger band strategy can add more meaning to this term in practice.
When prices are repelled by the top band twice it can mean that the market has run out of steam and a race to the bottom band could occur, these instances are a feature of volatility within the market.
In the above chart, prices were repelled twice, and then pushed down to the bottom band.
This double top also marked the beginning of a downtrend.
In this Bollinger bands strategy, you should look for three things to happen to pick out a double top formation and confirm the pattern.
- Firstly the price puts in a reaction high to the upper band.
- Next a pullback to the simple moving average.
- Then price moves back to the first high but will fail at or below the upper band.
The waning momentum causes the failure of the second high, we can then look for confirmation of the top with a break of support and I like to see two candles close whose real bodies are below the MA line.
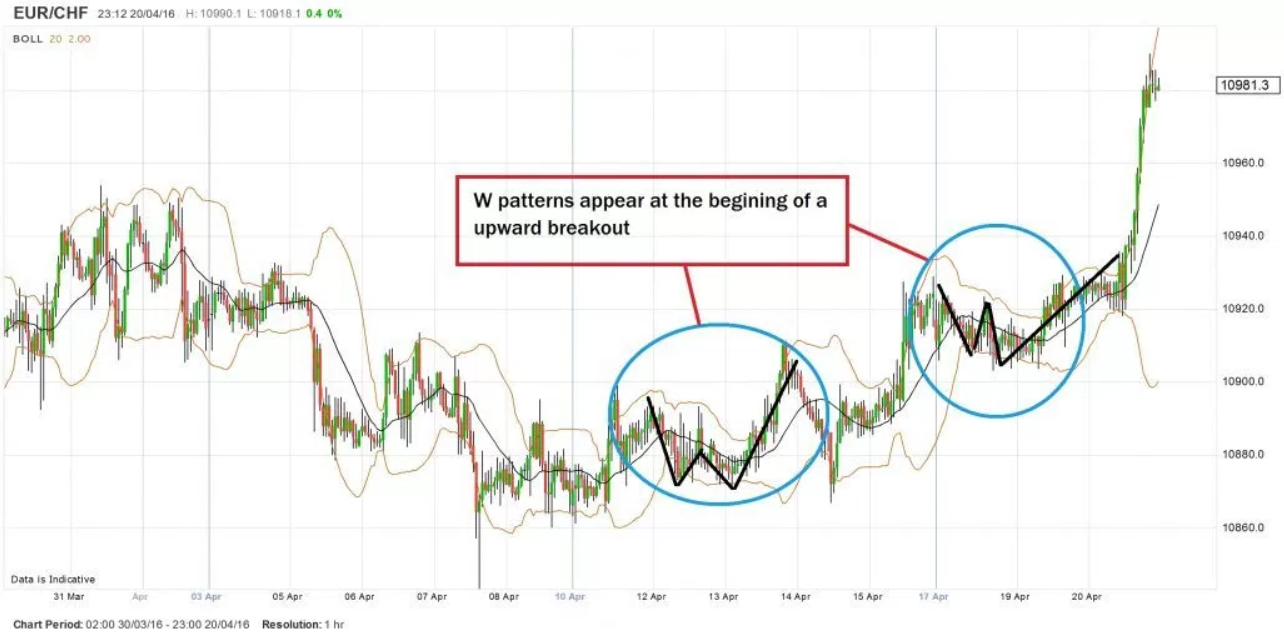
Double bottom formation:
The opposite will also occur regularly at significant lows.
Where prices drop to the bottom band twice in short order and then are repelled upwards, beginning an uptrend in the market.
In the chart above two W patterns formed in the uptrend, adding weight to the trend and signifying that a trader should stick with the trend.
There is a four step process in this Bollinger bands strategy to confirm a W bottom is in place.
- Firstly a low forms, usually below the lower band.
- next a retracement to the middle band.
- then a new low forms but will hold on or above the lower band showing a slowing of downside momentum.
- And lastly, the pattern is confirmed when the price rallies to the upper band and completes two candles whose real bodies are above the middle band.
A trader should always wait until all of the four steps are complete before trading the move. this will reduce false signals and spare your capital in the long run.
I will commonly use a stop loss order to trade this setup, using the higher ‘price low’ of the formation as the stop loss position.
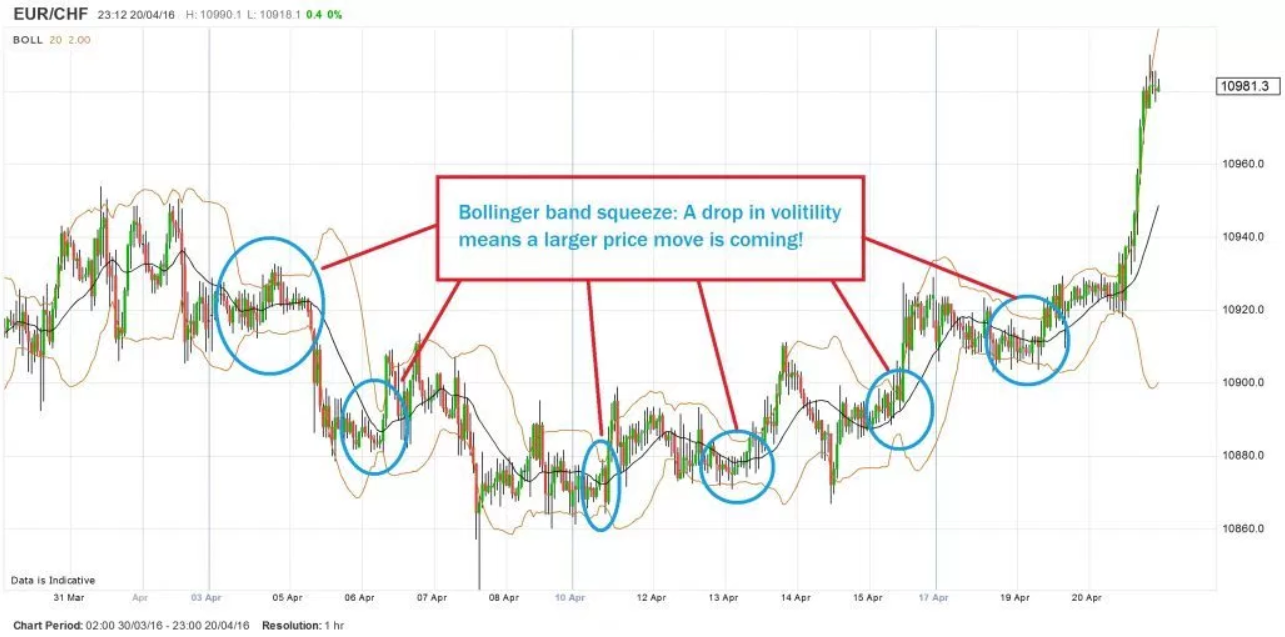
Bollinger band squeeze:
The Bollinger band squeeze happens when price movements contract to a narrow range.
This causes the Bollinger bands to move inwards towards each other.
It is almost like a pressure is building within the market and it will lead to a sharp movement in prices sooner rather than later.
In the example above, a squeeze always occurred before any significant move in prices.
It is a valuable indication of the possibility of volatility ahead.
So a trader will always be aware of the position and trend in the Bollinger bands. And if you notice the Bollinger bands ‘squeeze’ together, you can start to position yourself because a significant price movement is straight ahead.
How does it work?
When trading using this Bollinger bands strategy, we are looking for contraction in the bands. Above is the EURCHF 60 minute chart lets see what sort of signals are generated from it.
The chart above shows 20 point increments in EUR/CHF, every time the Bollinger band width is approaching 0.0010 or about 10 points, we get an average move away from the moving average of about 40 points sometimes more.
In the above case, a trader could use the squeeze as a signal generator, a signal is generated when:
- the bands squeeze to within about 10 points
- and a full candle completes above or below the moving average line.
depending on which side the candle completes that is the side you trade.
So, if a candle completes above the MA, then you go long, and if a candle completes below you go short. your stops should be placed at the opposite extreme of the candle.
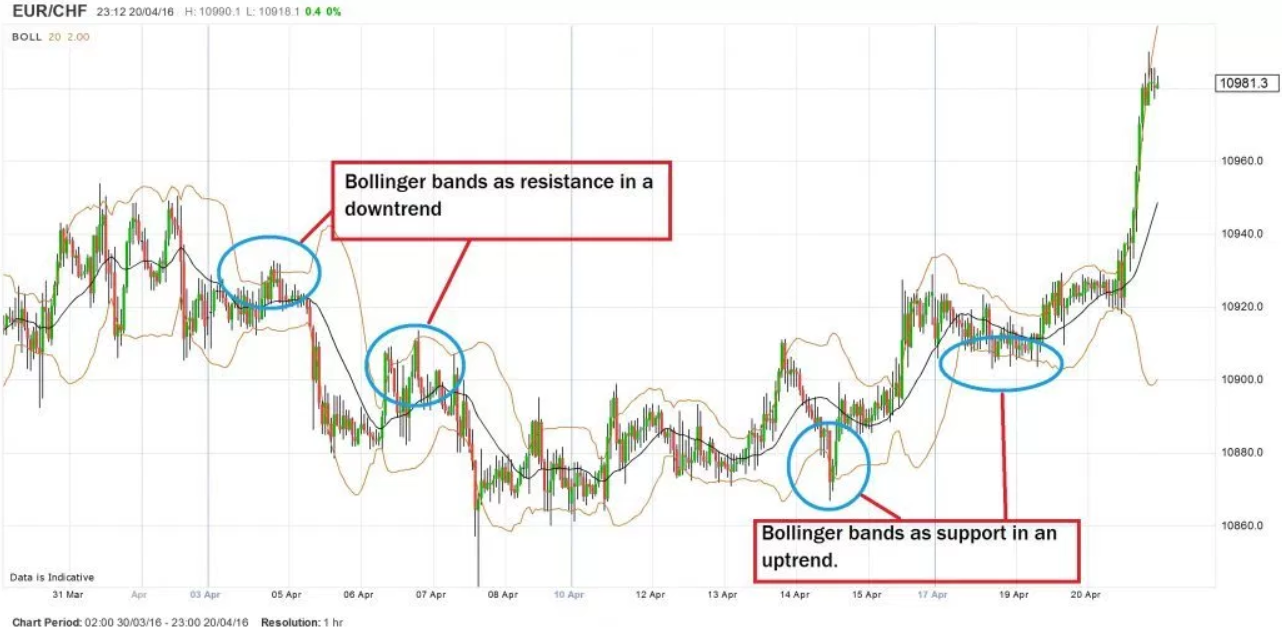
Bollinger bands as support and resistance:
Along with giving the trader an indication of future volatility ahead, this Bollinger bands strategy will show support and resistance in a trending market, often repelling prices back into the trend once more.
In both the downward trend and the upward trend i the chart above, the bands acted as consolidation points.
The fact that prices were repelled by the bands showed the trader that they could stick with the trend.
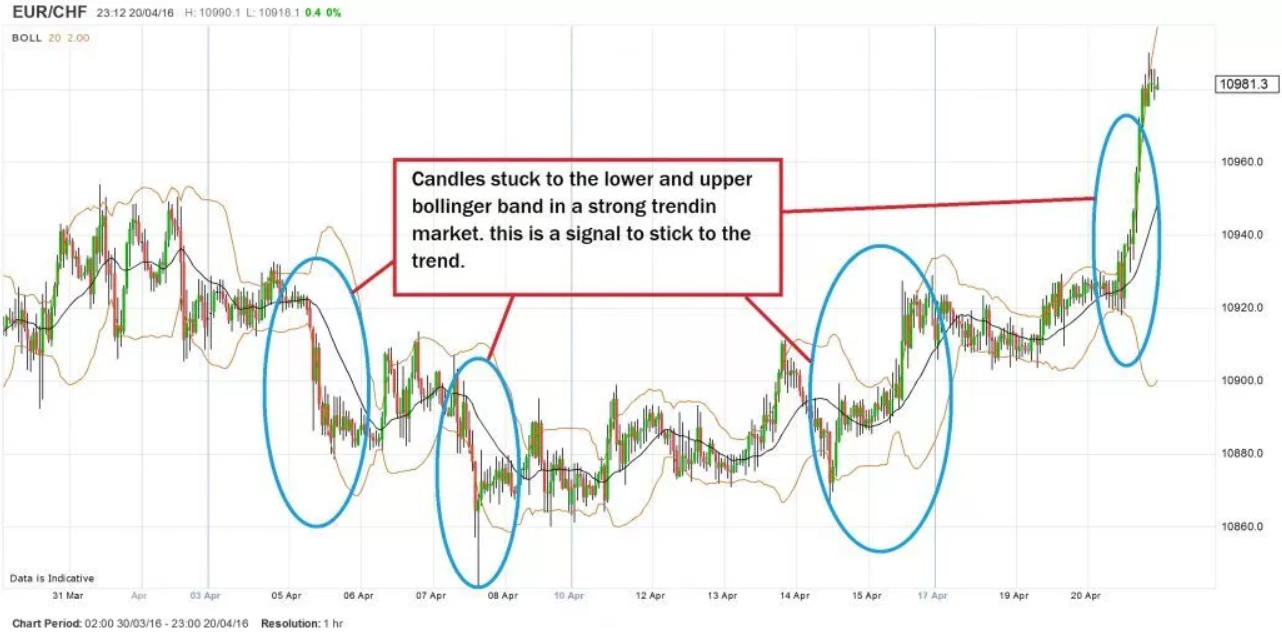
Riding the bands:
Another Bollinger bands strategy is riding the bands, this is when we use the bands as a trend recognition tool.
During strong trend moves, the candles tend to almost stick to the upper or lower band.
This occurrence shows the trader that the trend is likely to continue and has power behind it.
John Bollinger, the bands creator, calls a move that touch the bands a ‘tag’ of the band. this is not exactly a signal but it does denote a strengthening or weakening market.
Take note for a second;
the bands are placed 2 standard deviations away from the 20 period simple moving average on both sides. So the bands contain 95.6% of all the price moves in the last 20 periods.
If the price tags the upper or lower band, it shows us that there is significance in that move. Because it is more powerful than 95.6% of all the moves in the last 20 periods.
IF a powerful move occurs, it can be common for the simple moving average to act as support for the price. The price will usually stay above or below the SMA in a trend move. This knowledge can be used in managing your position when you are trend trading.
Things to take away:
When used alone the bands offer little in the way of timing or trade entry indicators.
But,
- The Bollinger bands do give the trader a useful benchmark to judge how the price action is likely to act given certain action.
- They can be a great tool to measure volatility, or lack thereof, in the market.
- And they can show you where likely support and resistance might occur within a trend.
- Bollinger band strategy uses these phenomena to trade trend moves within a market
These points alone are evidence enough that we all should take heed of the bands!
Once again I would like to make a note about the two webinars available for free on youtube on the subject of bollinger bands. You can watch them here and here. Don’t forget to subscribe!
Now it is your turn, comment, criticize, suggest and share. Bollinger bands is one of the best financial indicators and is here to stay. In fact there are people who have found a way to implement it outside the financial world.
In a paper published in 2006 by the Society of Photo-Optical Engineers, “Novel method for patterned fabric inspection using Bollinger bands“, Henry Y. T. Ngan and Grantham K. H. Pang present a method of using Bollinger bands to detect defects (anomalies) in patterned fabrics. From the abstract: “In this paper, the upper band and lower band of Bollinger Bands, which are sensitive to any subtle change in the input data, have been developed for use to indicate the defective areas in patterned fabric.”
The International Civil Aviation Organization is using Bollinger bands to measure the accident rate as a safety indicator to measure efficiency of global safety initiatives. %b and bandwidth are also used in this analysis.
Sources: http://humbletraders.com/ | https://en.wikipedia.org/


I’m glad you find it informative guys!
@ Kostas – I don’t describe it here as it is explained in the video. Here you learn something else. The more the better, no? You can use it for daily and weekly, principle is the same.
Vlad
excellent analysis but in the video that you posted you show duplication and 20 candles ride.why dont you describe here?and why dont you use bollinger bands for daily or weekly analysis because i didnt see?
Thank you so much for posting the webinars Vlad, will definitely watch it
I see myself a better trader day after day and this is all possible only with your help, thank you so much Vlad!
Wonderful post, really educating us on different strategies of Bollinger Bands.
Very informative..thanks for sharing.