
Hi Traders,
Here are the most recent Crystal Ball results that I’d like to share with you. If it looks too good to be true, that’s because it is! You already know the software and strategy is completely free (click here to get your copy) but beyond that, it is also completely open. I’m not giving you a “back box” where you don’t know why and how. Crystal Ball’s foundation is statistics. You can’t argue with the numbers! And as you can see below and in the previous articles like this one and this one, it simply works!
The entry methods used are classical and easy to follow. When you put it all together, there is no reason why this strategy and software won’t deliver profits! And if you are looking for simplicity and good returns, Forex Crystal Ball is the right option to add to your portfolio.
EURCAD Sell Setup
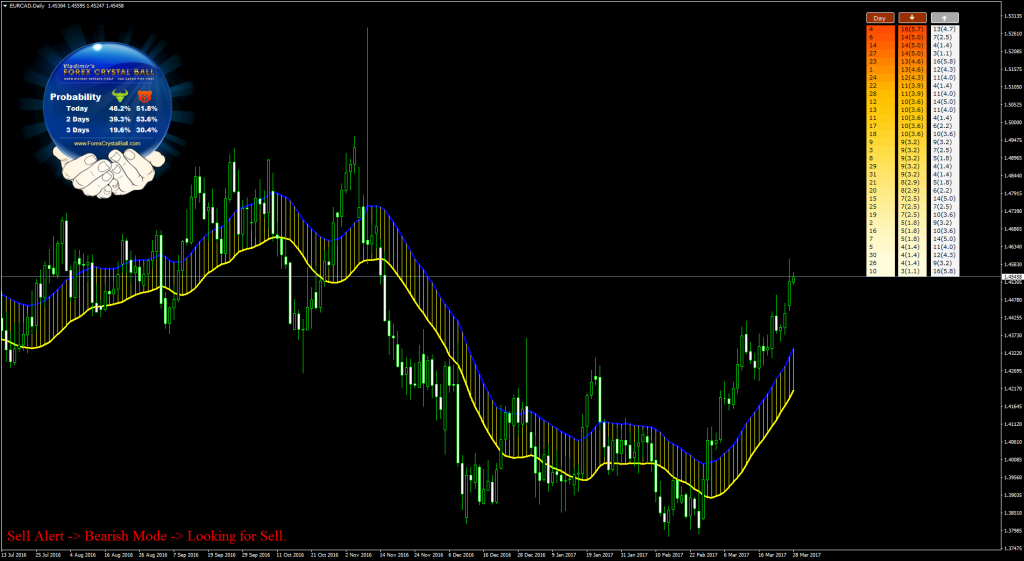
D1 Chart
- Price is way above the channel.
- Statistical indicator turned orange = look for sells.
- Crystal Ball probabilities suggest bearish days are coming.
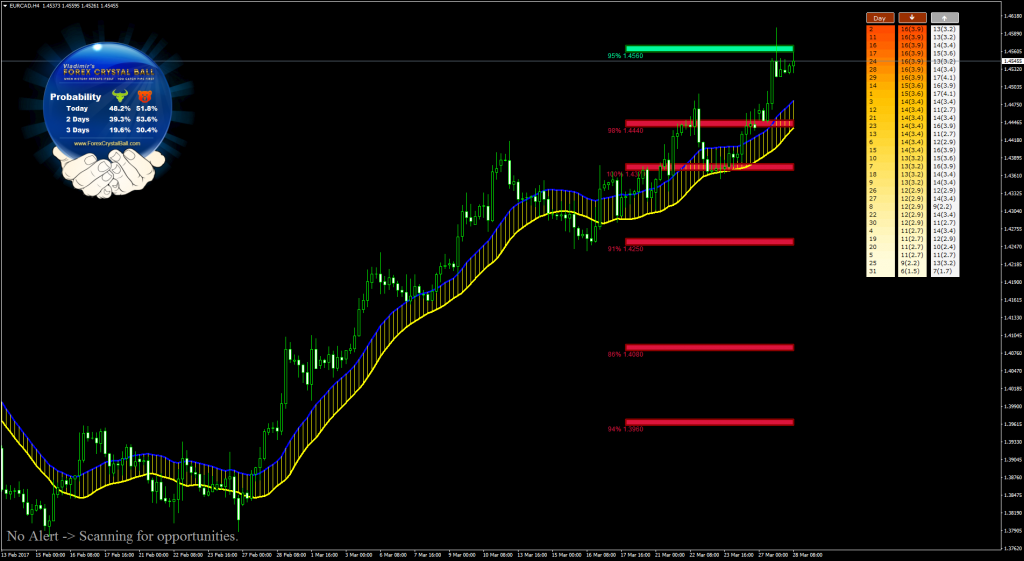
H4 Chart
- Price rejected the breakout and created a beautiful spike, then closed below the green resistance zone.
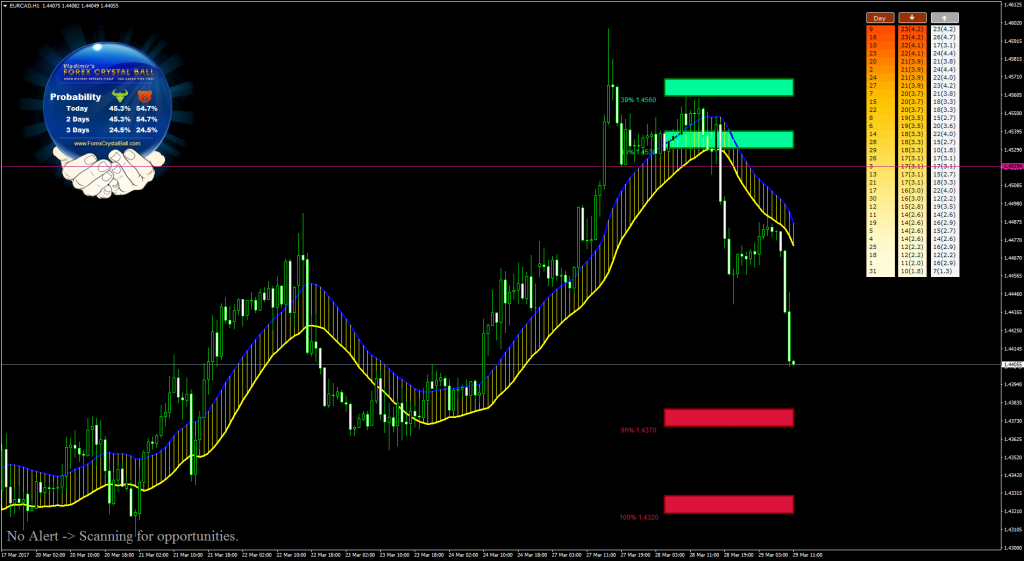
H1 Chart
- We are following the H1 chart step trading setup, as the trend line is not the best one in this case.
- Price rejected from the H1 resistance zone as well.
H1 Chart Result
If you like the Forex Crystal Ball and want to achieve the same result or even better – you can download it for free. Click on the button below to get your copy.
UK100 Buy Setup
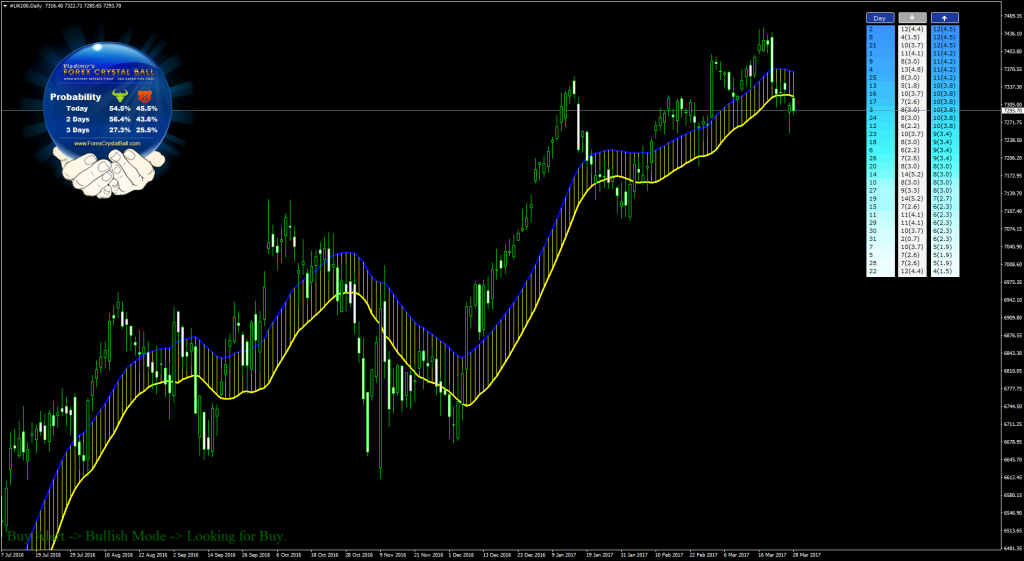
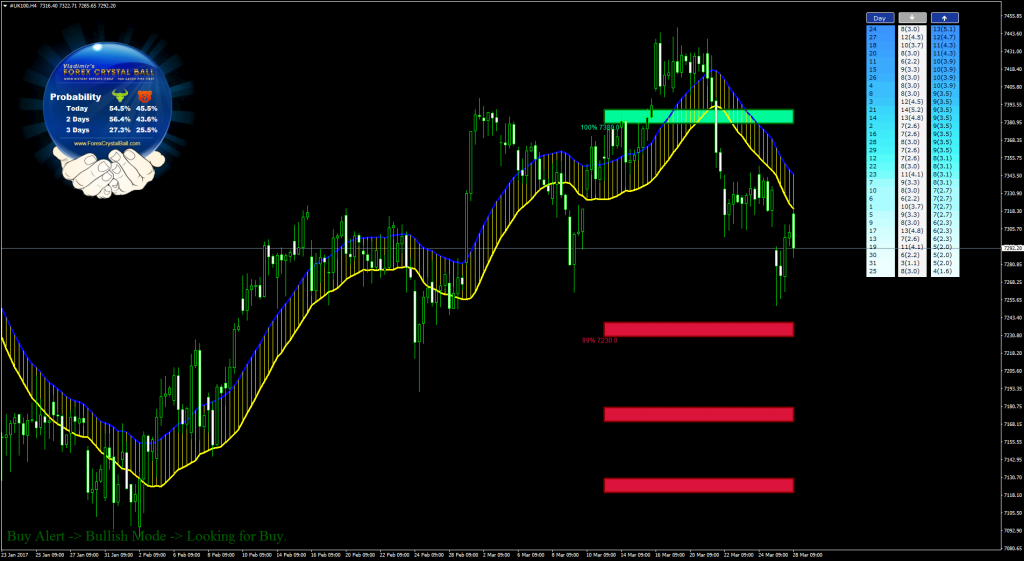
D1 Chart
- Crystal Ball probabilities – check.
- Statistical indicator – check.
- Channel pointing upwards signifying up trend, breakout below it but ending with bullish candle pattern (last closed candle). The only weak link in this setup but still worth the risk as everything else is in agreement.
H4 Chart
- Price seems to be respecting the closest support (red zone marked on the chart) as it is bouncing off of it.
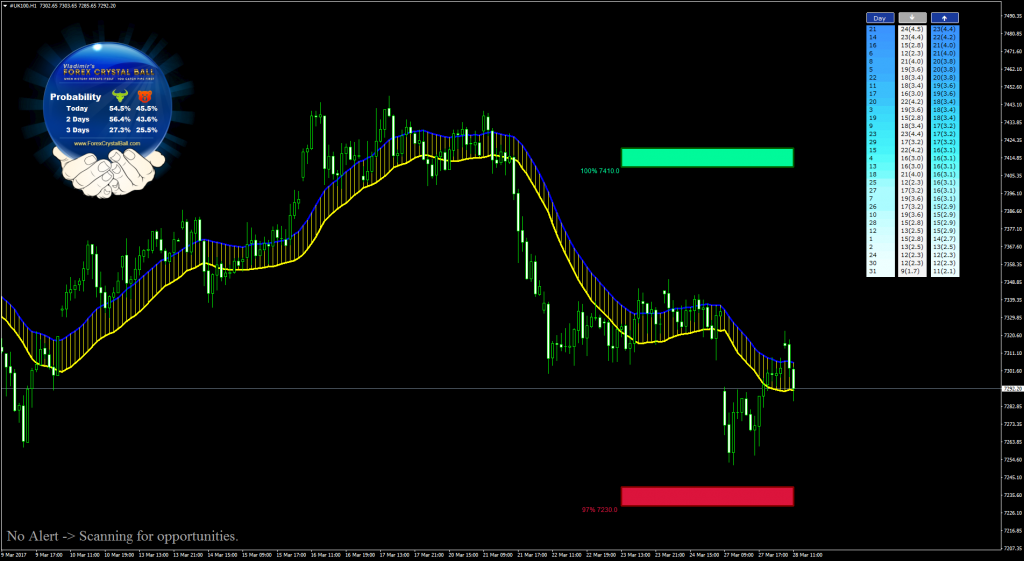
H1 Chart
- Step trading would be more aggressive here and bring more profits but i’m a conservative trader and thus waited for trend line breakout.
H1 Chart Result
- The push up gave us a bit more conservative entry with the trend line breakout.
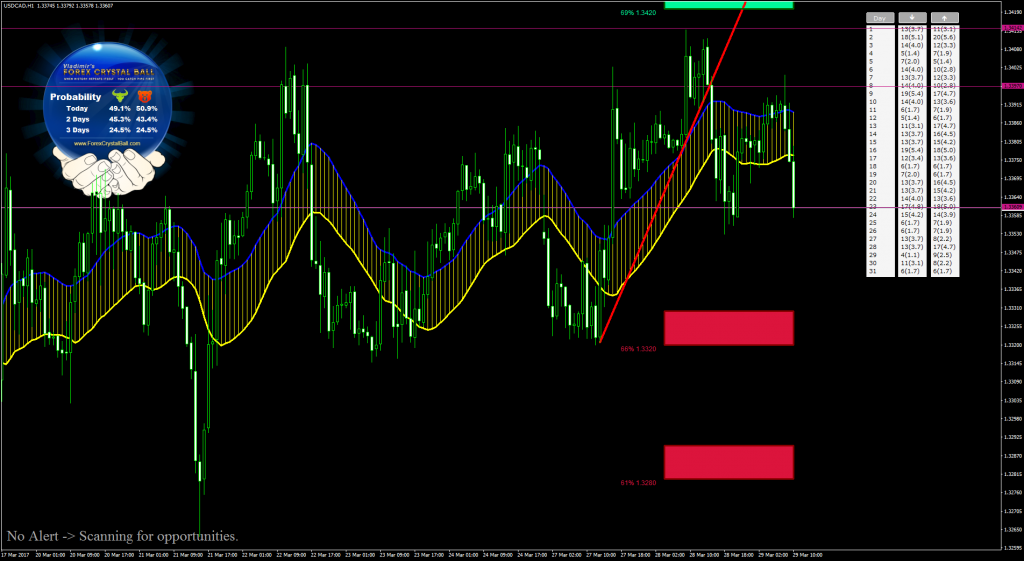
USDCAD Sell Setup
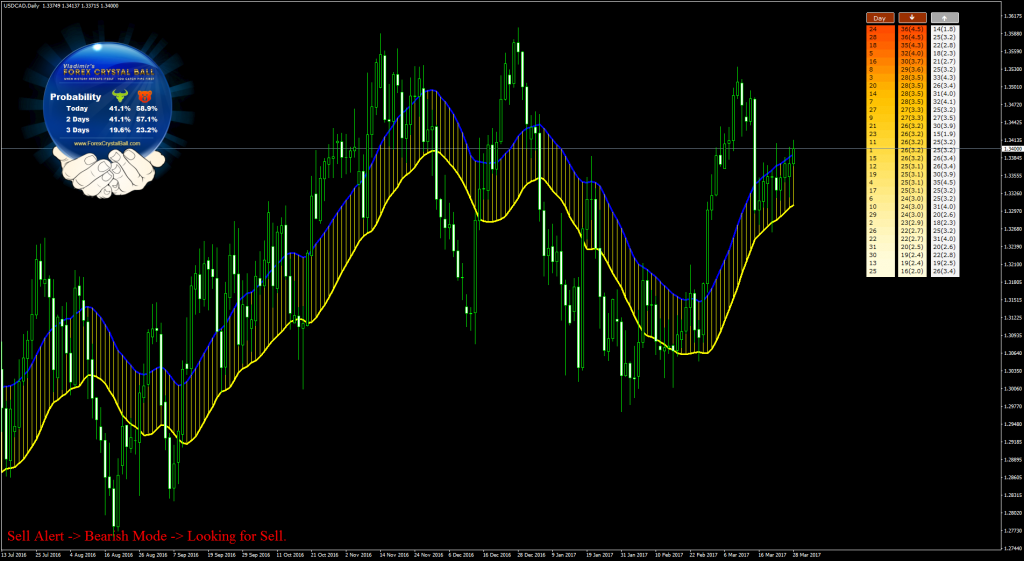
D1 Chart
- Channel pointing up but notice the huge bearish bar. Such strong move definitely means something and we must respect the market. Price trying to break above it, but it is still stuck inside the channel. Notice also that the boundaries of the channel (blue and yellow lines) are pretty accurate, playing the role of dynamic support/resistance, which means price is also in resistance zone (blue line of the channel)
- Crystal Ball with amazing readings of 58.9% and 57.1%.
- Statistics – agrees for down as well.
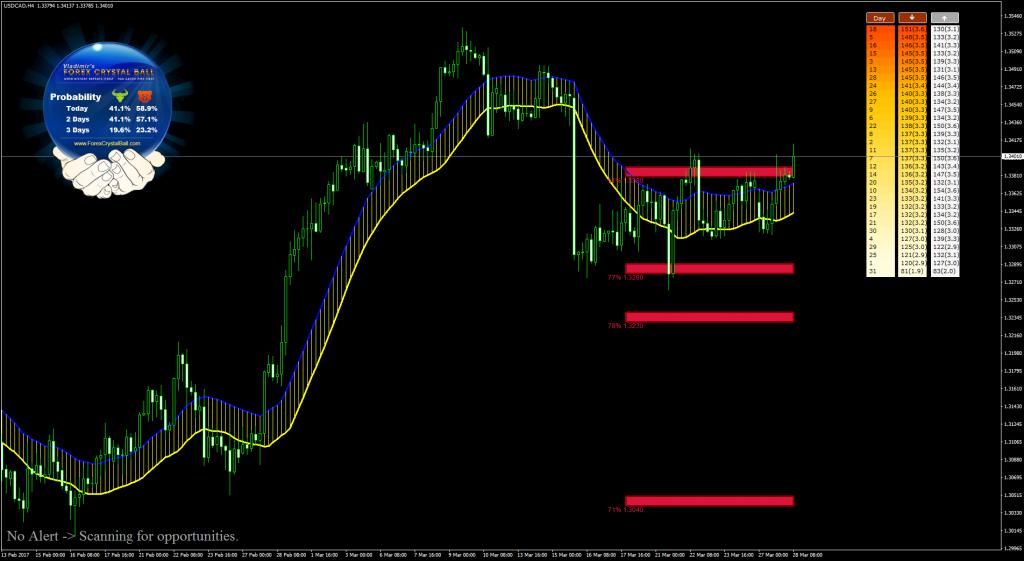
H4 Chart
- Price is trying to break above the top red S/R zone but it gets rejected every time. This is important! Notice the huge bearish bar on the left. Even after 10 days or so, price is still far away from this bar’s high. This tells us only thing – bears are gathering up and a push down is very likely to happen. Price action 101. Combine that with the Crystal Ball probabilities and the Statistics and we have a really high probability setup forming here.
H1 Chart
- Price is near the top of the range, resistance zone right above it.
- We have a not bad trend line to follow. The risk:reward that it gives us is acceptable. Overall analysis point out that this is a worthy setup.
H1 Chart Result
If you like the Forex Crystal Ball and want to achieve the same result or even better – you can download it for free. Click on the button below to get your copy.
Yours,
Vladimir







Amazing!!!
Excellent