




Hello traders, Vladimir here from Home Trader Club, and welcome to another Forex Weekly Forecast.
What a week it was across the financial markets.
The latest move in the U.S. bond market has created a new liquidity narrative, with the U.S. Treasury announcing that it will at least double the size of its liquidity-support buyback operations for longer-dated Treasury securities. The maximum size will increase from $2 billion to at least $4 billion per operation for the 10–20-year and 20–30-year sectors, beginning September 9 and continuing through November 4.
This announcement came after the 30-year Treasury yield moved above 5.3%, reaching its highest level since 2007 and highlighting the stress that had developed in the long end of the bond market.
So the big questions for traders this week are:
Can EUR/USD continue toward 1.1800 and 1.2000?
Can GBP/USD continue its bullish structure and eventually move above 1.4000?
Is Gold preparing for another major rally toward 4,800 and potentially 5,000?
Can Bitcoin recover toward 95,000–97,000 and eventually challenge 105,000–110,000?
Let’s break it all down.
- 1 Trade with AvaTrade and Unlock Unlimited Home Trader Club Access
- 2 Watch the Full Weekly Forecast Video
- 3 What Happened in the Markets This Week?
- 4 EUR/USD Weekly Forecast – Pullback Before the Next Bullish Leg?
- 5 GBP/USD Weekly Forecast – Can the Pound Move Above 1.4000?
- 6 Gold Weekly Forecast – Is Gold Heading Toward 4,800 and 5,000?
- 7 Bitcoin Weekly Forecast – Can BTC Recover Toward 100,000?
- 8 Pro Trading Tip
Trade with AvaTrade and Unlock Unlimited Home Trader Club Access
We have partnered with AvaTrade, one of the industry’s leading regulated brokers.
When you open and trade with AvaTrade through our partnership, you receive:
- Unlimited access to Home Trader Club
- Real-time trading education
- Daily and swing trading opportunities
- Our complete educational library
- Access to our Trade Copier Project
- Members-only trading community
If you’re looking to accelerate your trading journey while enjoying premium education, this partnership gives you everything you need under one roof.
If you already have account with them, still follow this link to open separate account with separate email. Once you did that, contact me with the telegram link below and we will give you the access.
 Watch the Full Weekly Forecast Video
Let’s go straight into the charts.
What Happened in the Markets This Week?
The major development was the U.S. Treasury’s decision to increase the size of its long-end liquidity-support buybacks.
The previous maximum was $2 billion per operation. Treasury has now increased that to at least $4 billion per operation, targeting longer-dated nominal securities in the 10–20-year and 20–30-year sectors.
The timing is important.
The move came after significant pressure developed in the long-duration Treasury market, with the 30-year yield reaching approximately 5.34%, its highest level since 2007. Following the announcement, long-term Treasury yields declined sharply.
This matters for financial markets because lower long-term yields can improve the environment for risk assets, commodities and other markets that are sensitive to liquidity and the U.S. Dollar.
However, there is an important distinction.
Is This Quantitative Easing?
Not really.
This should not automatically be treated as a new round of quantitative easing.
The Treasury is buying back previously issued securities in the secondary market as part of its liquidity-support program. This is different from the Federal Reserve conducting large-scale asset purchases specifically to expand its balance sheet and create additional bank reserves.
So while the market reaction can look somewhat similar, the mechanism is very different.
For traders, the important question is not necessarily what we call the policy.
The important question is:
How does the market respond?
At the moment, the reaction has been supportive for several risk-sensitive markets, while the U.S. Dollar has faced additional pressure.
That creates an interesting environment for:
- EUR/USD
- GBP/USD
- Gold
- Silver
- Bitcoin
- Other risk-sensitive assets
Now let’s look at the charts.
EUR/USD Weekly Forecast – Pullback Before the Next Bullish Leg?
EUR/USD received a strong boost during the previous week.
The bigger question now is:
What’s coming next?
The longer-term picture remains somewhat unclear to me at this stage.
There is still a possibility that EUR/USD can eventually continue higher and potentially reach 1.1800, 1.2000 and even higher levels over the longer term.
But on the shorter timeframes, I believe traders should be prepared for a potential pullback first.
EUR/USD Technical Outlook
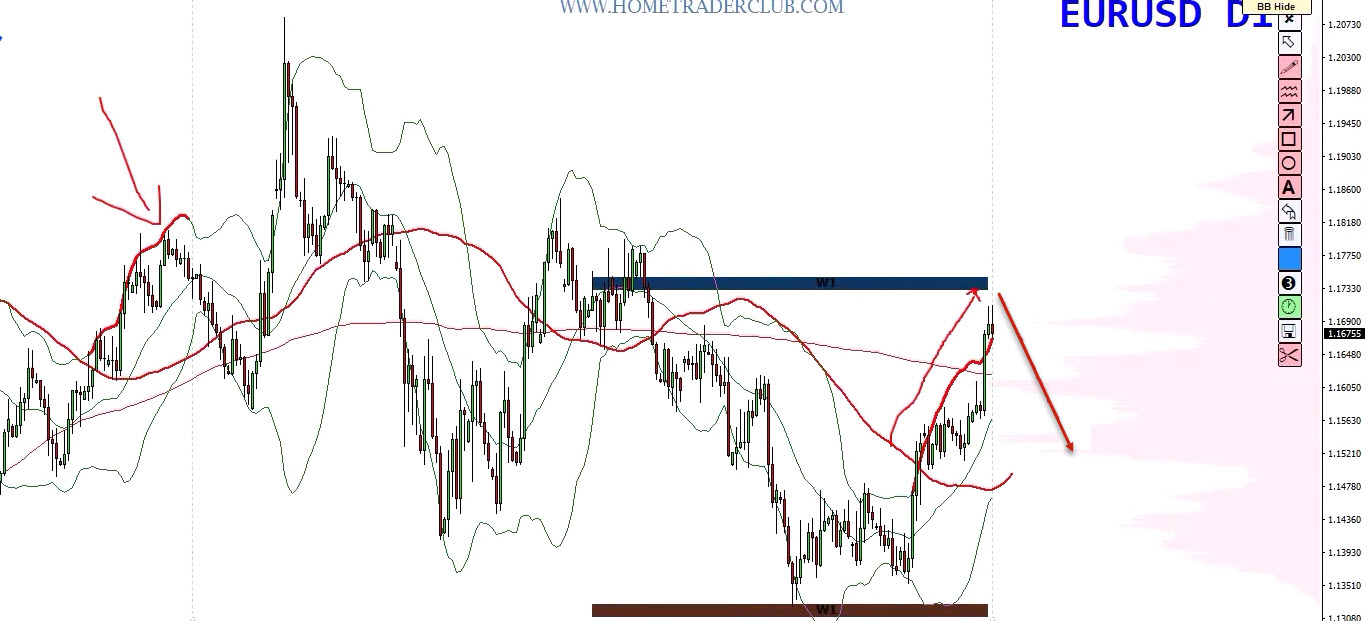
One of the most interesting things on the chart is the persistent bullish price action.
EUR/USD has been riding the upper Bollinger Band for an extended period, with more than 20 candles showing strong upward pressure without a significant retracement.
This is a sign of strength.
But it can also create short-term exhaustion.
When price remains extended near the upper Bollinger Band for such a long period, the probability of a corrective move can increase.
That does not automatically mean the larger bullish trend is finished.
It simply means that the market may need to breathe before continuing higher.
What I Am Watching
There are two main scenarios I am interested in.
Scenario 1 – EUR/USD Rallies First
If EUR/USD continues climbing from current levels, I will be watching for signs of rejection and bearish confirmation.
If price reaches a significant resistance area and begins forming:
- Lower highs
- Bearish momentum
- Rejection candles
- Short-term bearish structure
I would look for opportunities to sell the retracement.
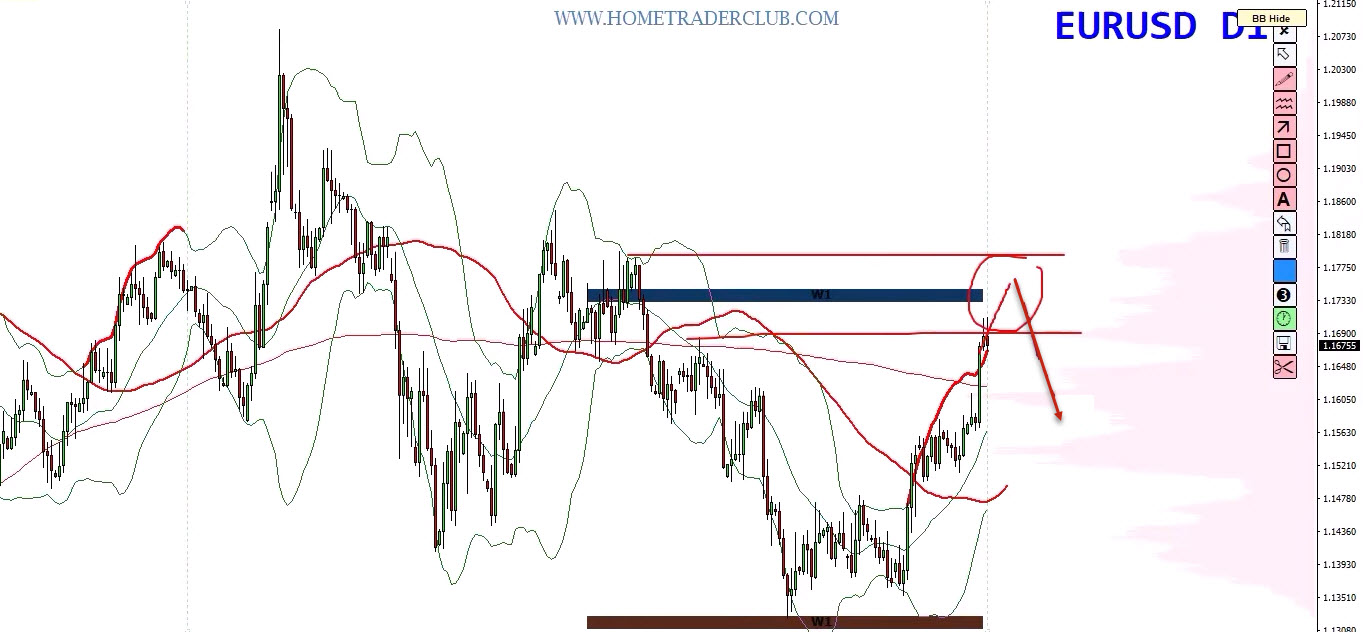
The key here is not to sell simply because price is high.
I want confirmation.
Scenario 2 – EUR/USD Pulls Back First
This is the scenario I find more interesting for a potential longer-term bullish continuation.
If EUR/USD pulls back into a strong support or demand area and buyers appear, I would look for opportunities to buy the dips.
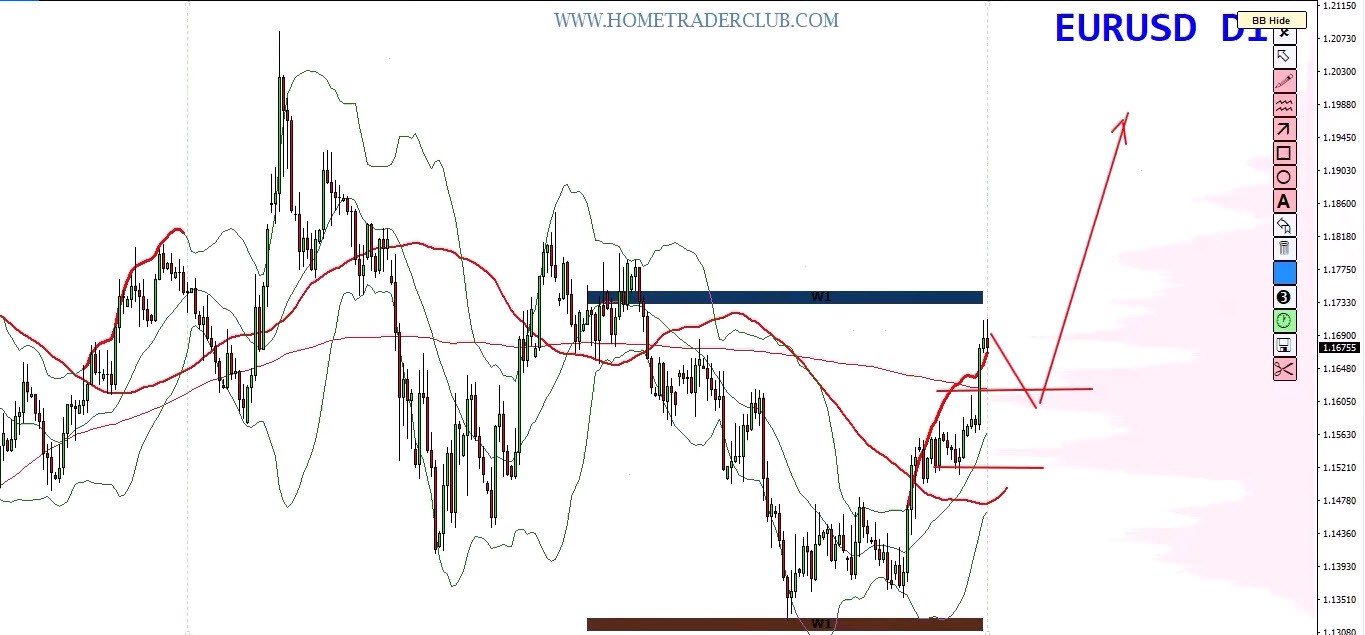
As long as the important bullish structure remains intact, the next upside targets could eventually include:
1.1800 → 1.2000 → potentially higher
The bigger long-term target could be even more ambitious, but we do not need to predict everything in advance.
Let the market confirm each step.
EUR/USD Trading Bias
Short-term: Watch for a potential pullback or rejection.
Long-term: Bullish while the important support structure remains intact.
My preferred approach is simple:
Sell the rallies if bearish confirmation develops. Buy the dips if strong support holds.
GBP/USD Weekly Forecast – Can the Pound Move Above 1.4000?
GBP/USD has been one of the markets I have remained constructive on for the longer term.
As I have discussed in previous forecasts, I believe the Pound has the potential to eventually move above 1.4000.
The question is whether the current bullish structure can continue without a deeper correction first.
Right now, I like what the chart is showing.
GBP/USD Technical Outlook
GBP/USD has broken above the previous range and is holding above the Volume Profile balance area.
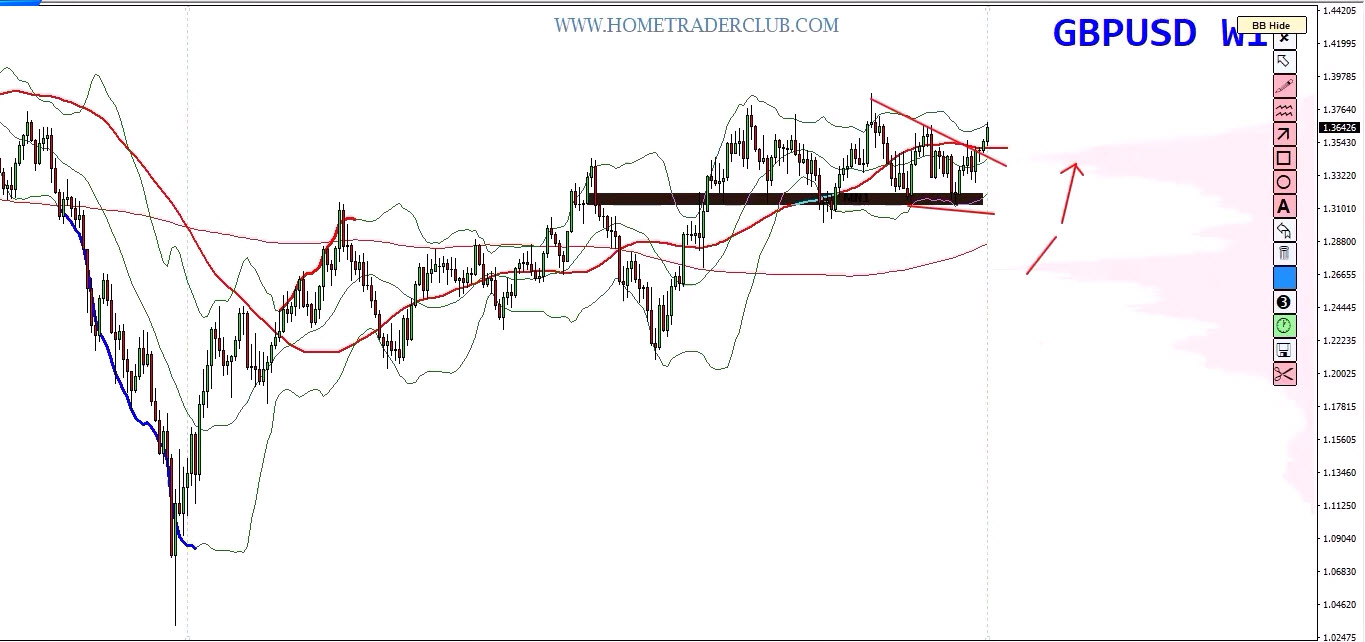
This is an important technical development.
When price breaks above a major balance area and successfully holds above it, it can indicate that buyers are gaining control.
At the same time, the market is building:
- Higher highs
- Higher lows
- Bullish price structure
- Strength above the previous balance area
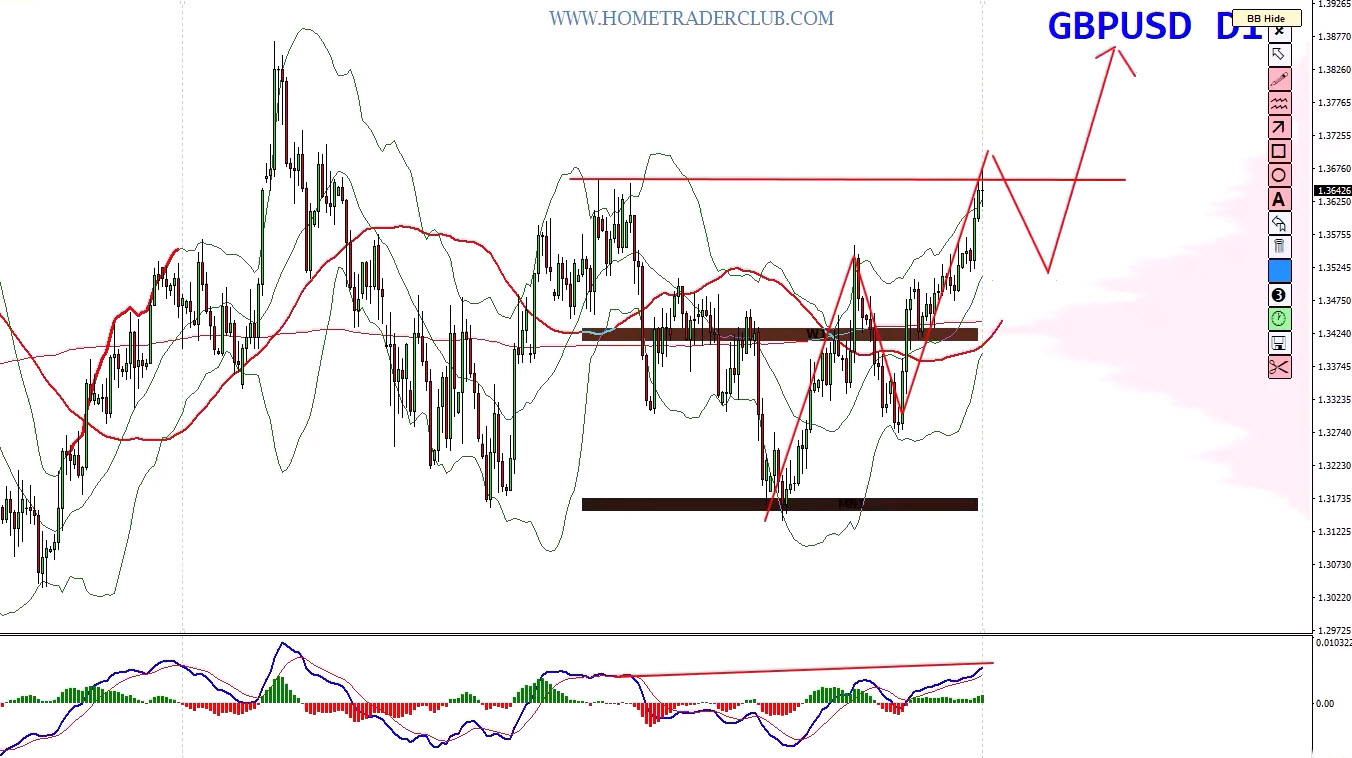
Another positive factor is that I do not currently see a significant bearish divergence that would immediately invalidate the bullish structure.
That makes me interested in buying the dips.
Where Could the Pullback Come From?
There are two possibilities.
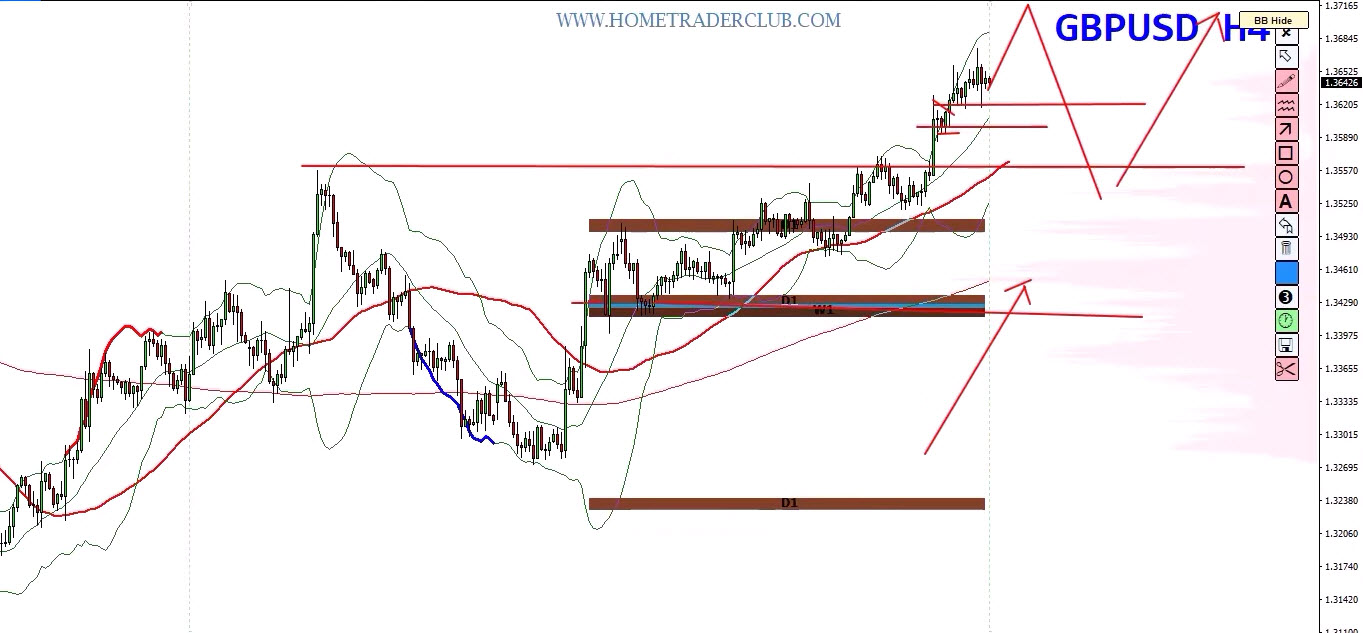
GBP/USD could pull back from the current area.
Or it could make another bullish spike first and then experience the correction.
Either scenario can work for the bullish plan.
The important area is the previous consolidation and breakout structure.
If price returns toward this area and finds support, I would be interested in looking for bullish confirmation.
GBP/USD Trading Plan
The strategy is therefore:
Buy the dips while the bullish structure remains intact.
If the Pound continues building higher highs and higher lows, the longer-term target remains:
1.4000 and potentially above.
Of course, reaching 1.4000 does not mean price must move there in a straight line.
There can be several corrections and consolidations along the way.
That is why I prefer buying confirmed pullbacks rather than chasing strong bullish candles.
GBP/USD Trading Bias
Short-term bias: Bullish
Long-term bias: Bullish
Key strategy: Buy the dips while price holds above the important breakout and Volume Profile area.
Gold Weekly Forecast – Is Gold Heading Toward 4,800 and 5,000?
Now let’s move to Gold.
This is probably one of the most interesting markets on the chart right now.
In the previous weekly forecast, we discussed the 4,400–4,500 region as an important area where Gold could find support before potentially continuing higher.
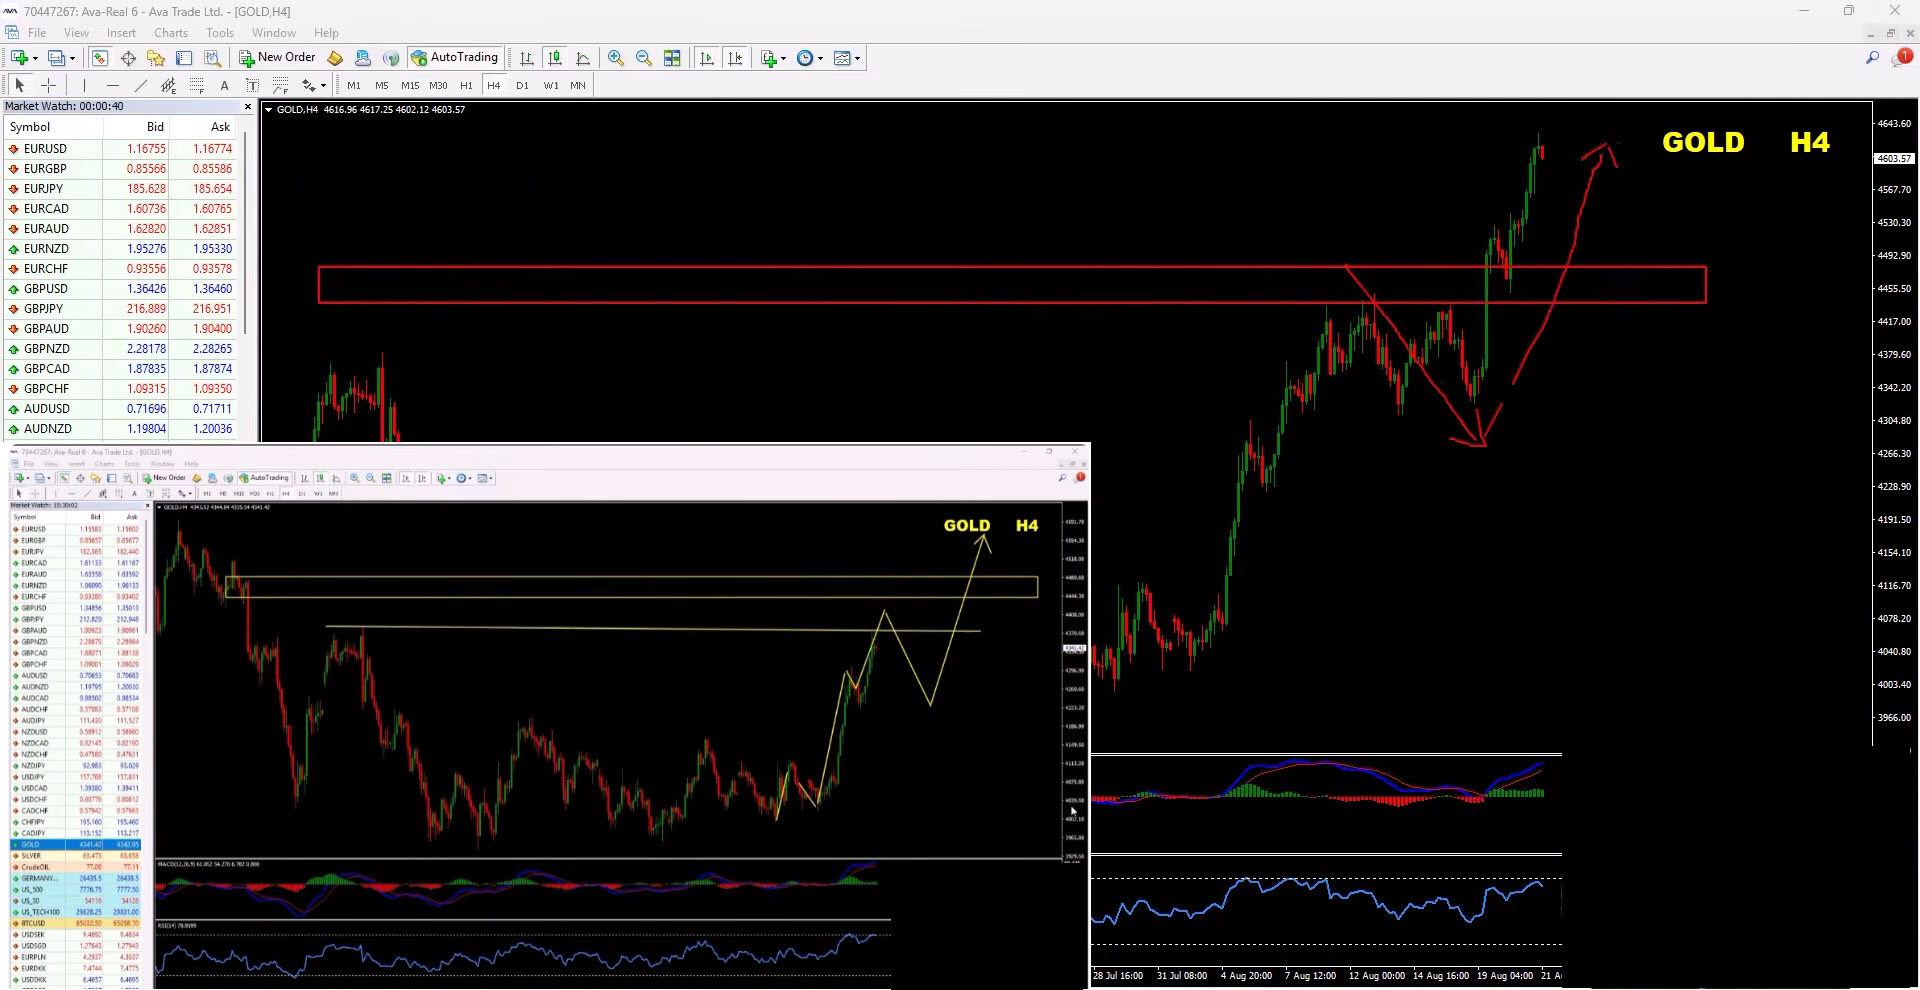
That scenario played out.
Gold reacted from the expected area and buyers returned.
Now the question becomes:
What’s next for Gold?
At this stage, I believe the technical evidence remains bullish.
Gold Technical Outlook
There are several reasons why I remain constructive on Gold.
First, we have bullish divergence.
Second, the price structure is bullish.
We are seeing:
- Higher highs
- Higher lows
- Bullish RSI structure
- RSI holding above 50
- Strong price momentum
- Support holding below current price
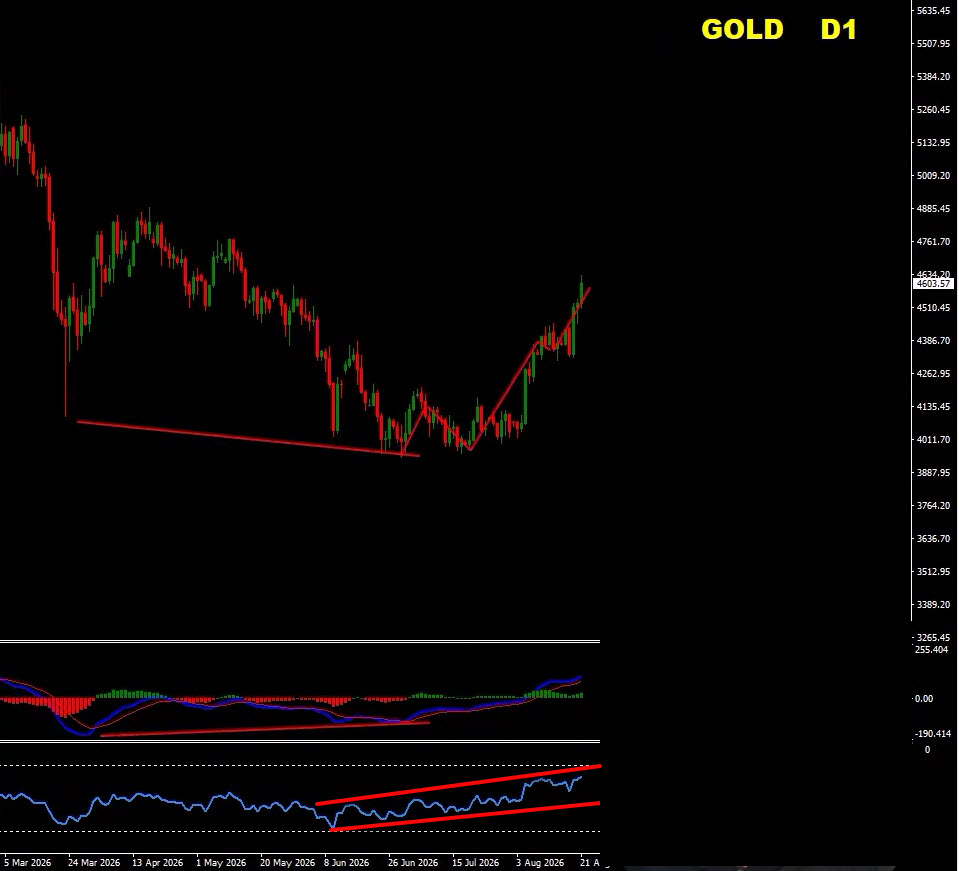
There are currently no major technical warning signs that convince me the bullish structure is finished.
That does not mean Gold cannot pull back.
In fact, I expect pullbacks to provide some of the better opportunities.
Gold Upside Targets
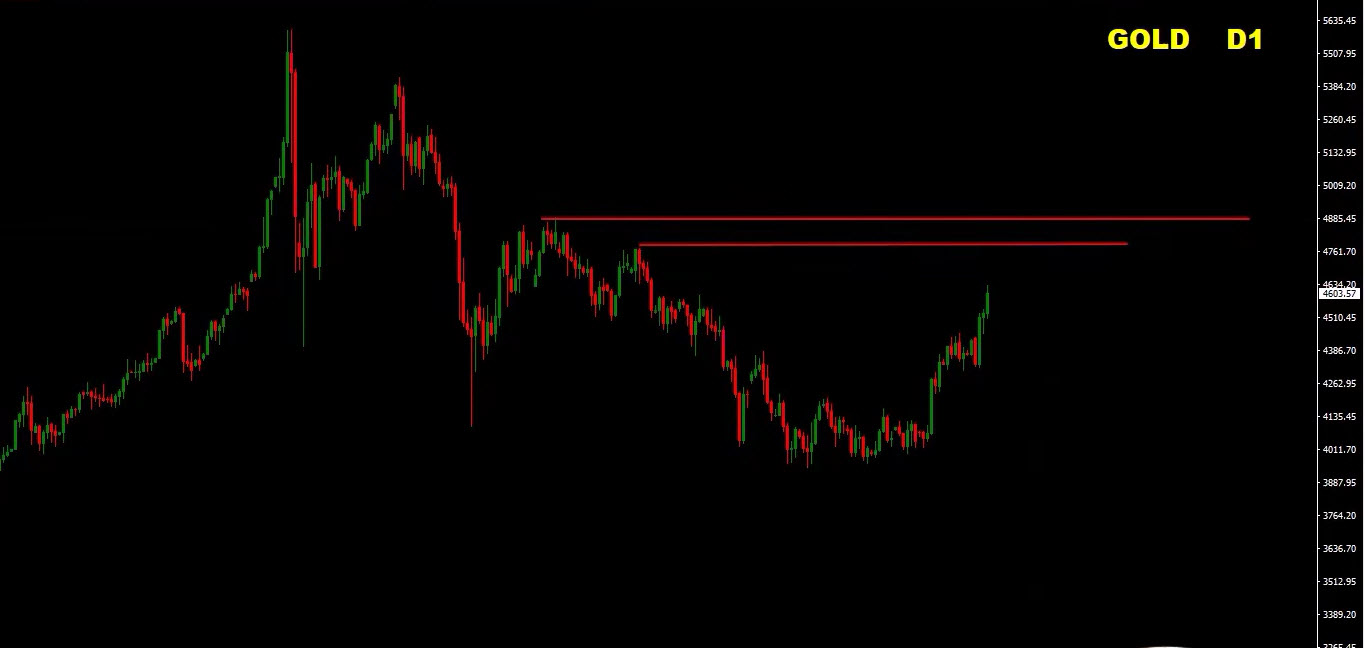
The first major upside area I am watching is approximately:
4,800
Above that, we have another extremely important psychological and technical area around:
5,000
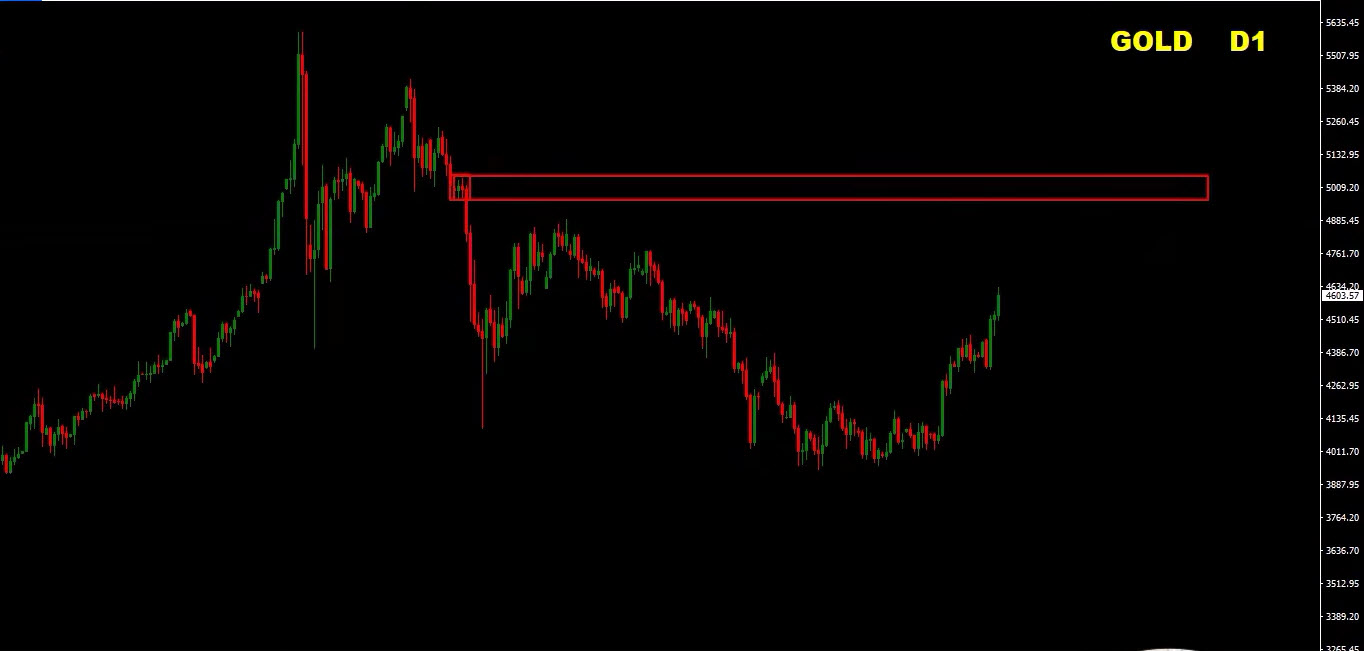
The 5,000 level is particularly interesting because psychological round numbers can attract significant market attention.
However, I do not want to simply assume Gold will reach 5,000.
The market still needs to prove itself.
Key Gold Support Zone
The most important area I am watching is the recent consolidation above 4,500.
As long as this region continues acting as demand, I would prefer to look for buying opportunities on pullbacks.
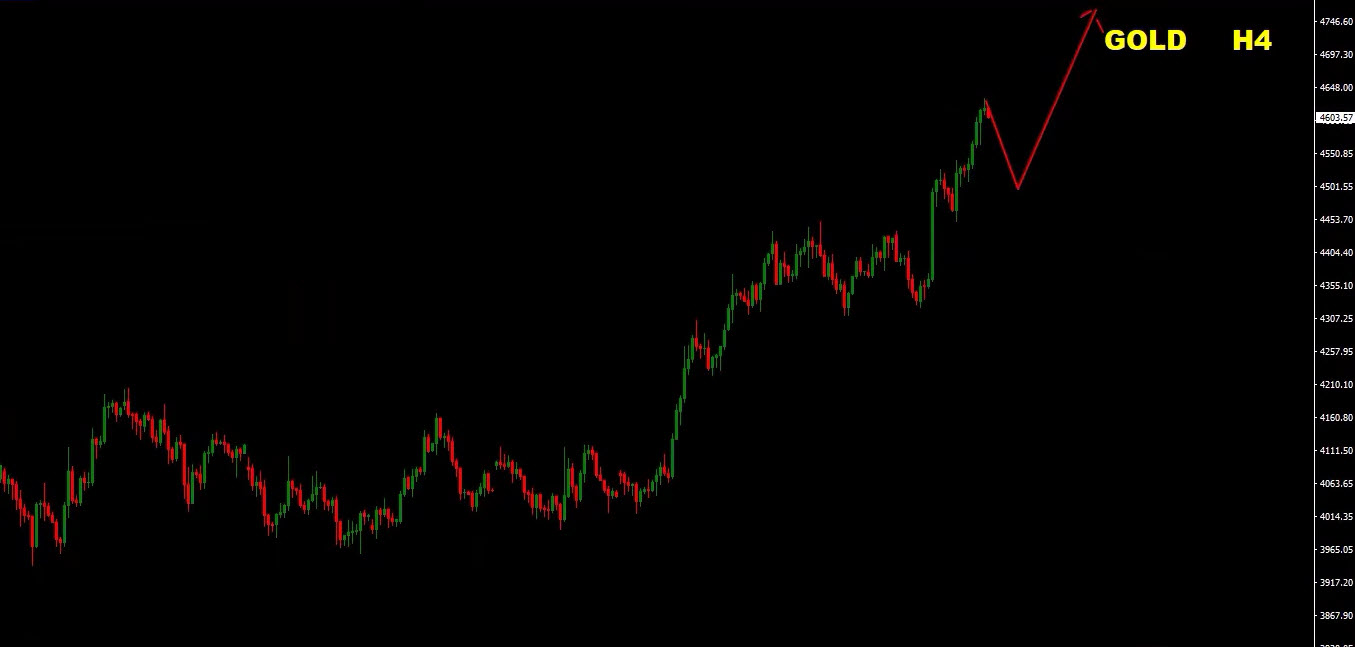
The structure remains:
Bullish → Pullback → Buy → Continuation
provided the key support levels continue to hold.
Gold Trading Plan
If Gold pulls back toward the important support areas and bullish confirmation appears, I would look for opportunities to buy.
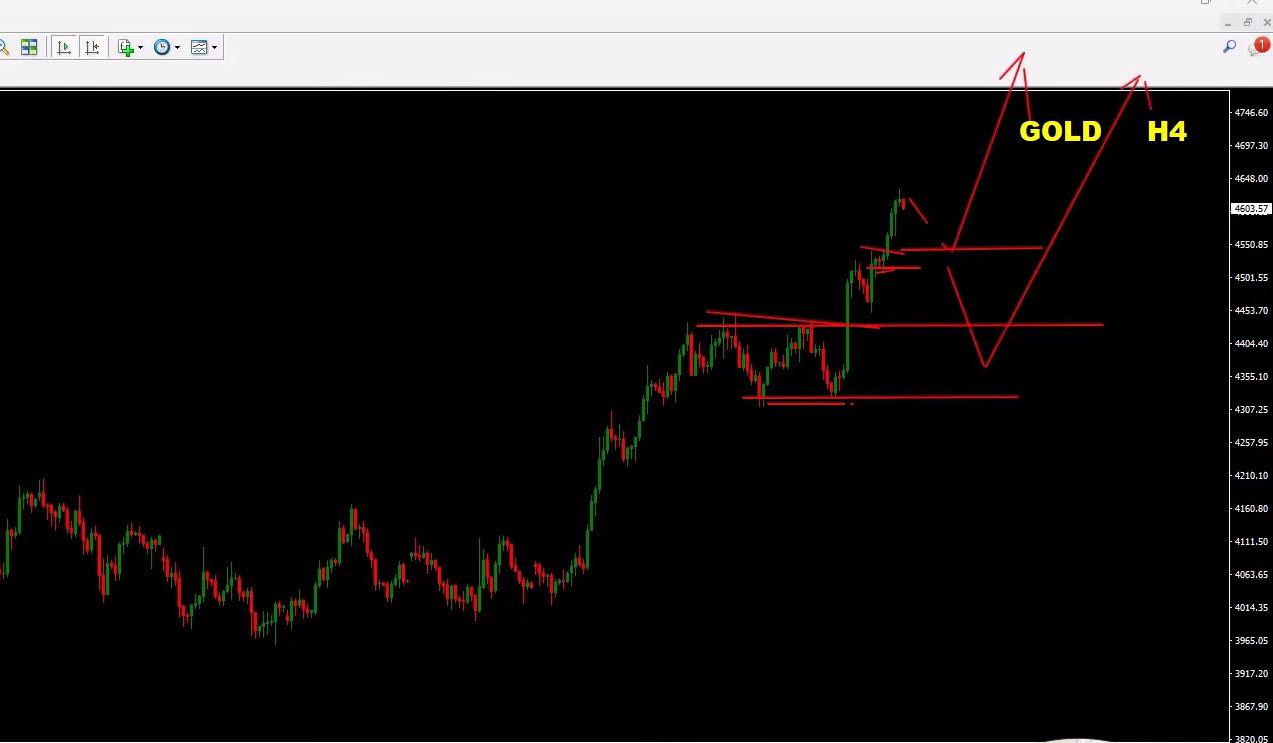
Potential upside targets:
4,800 → 4,900 → 5,000
If Gold reaches the 4,800–5,000 region, I would become much more interested in watching for signs of exhaustion, bearish divergence or a structural reversal.
But until the market gives us that confirmation:
I prefer buying the dips.
Gold Trading Bias
Bias: Bullish
Key support: Around the recent 4,500+ consolidation
Upside targets: 4,800–5,000
The bullish trend deserves respect until the market tells us otherwise.
Bitcoin Weekly Forecast – Can BTC Recover Toward 100,000?
Let’s talk about Bitcoin.
In the previous analysis, I was expecting Bitcoin to eventually clear the important descending structure before making a stronger move higher.
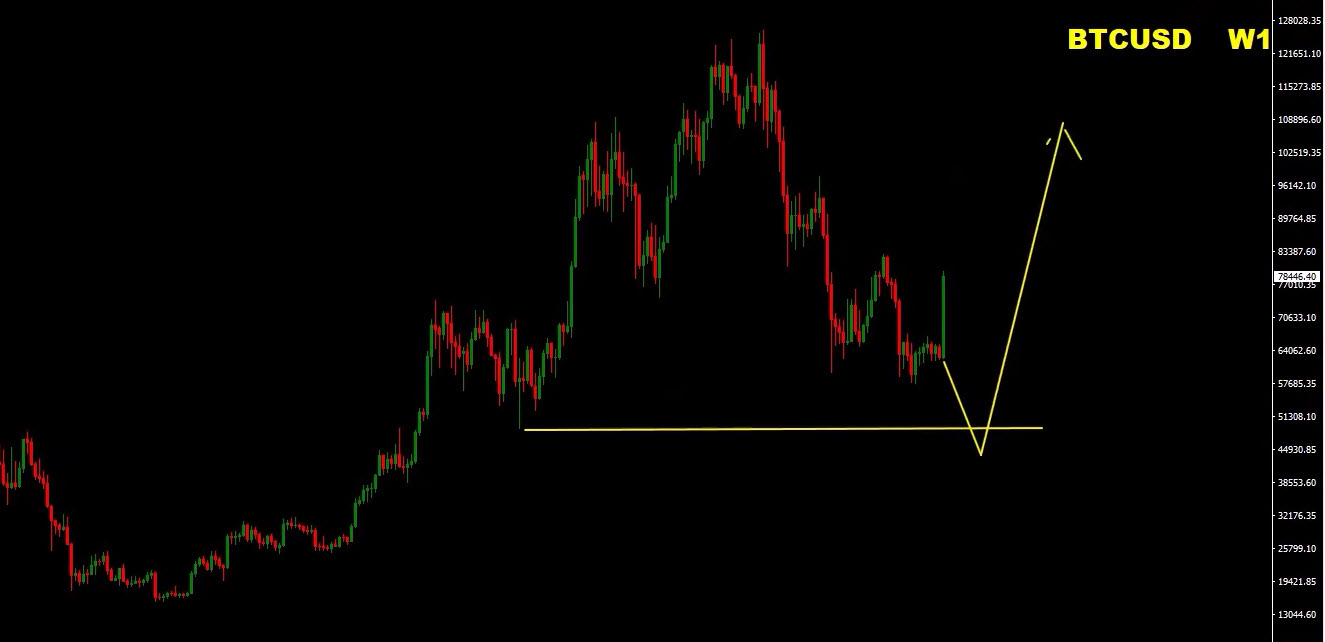
This week, Bitcoin finally delivered the breakout I was watching.
The market also produced an important bullish divergence before the breakout.
Now we have:
- Bullish divergence
- Breakout above the previous high
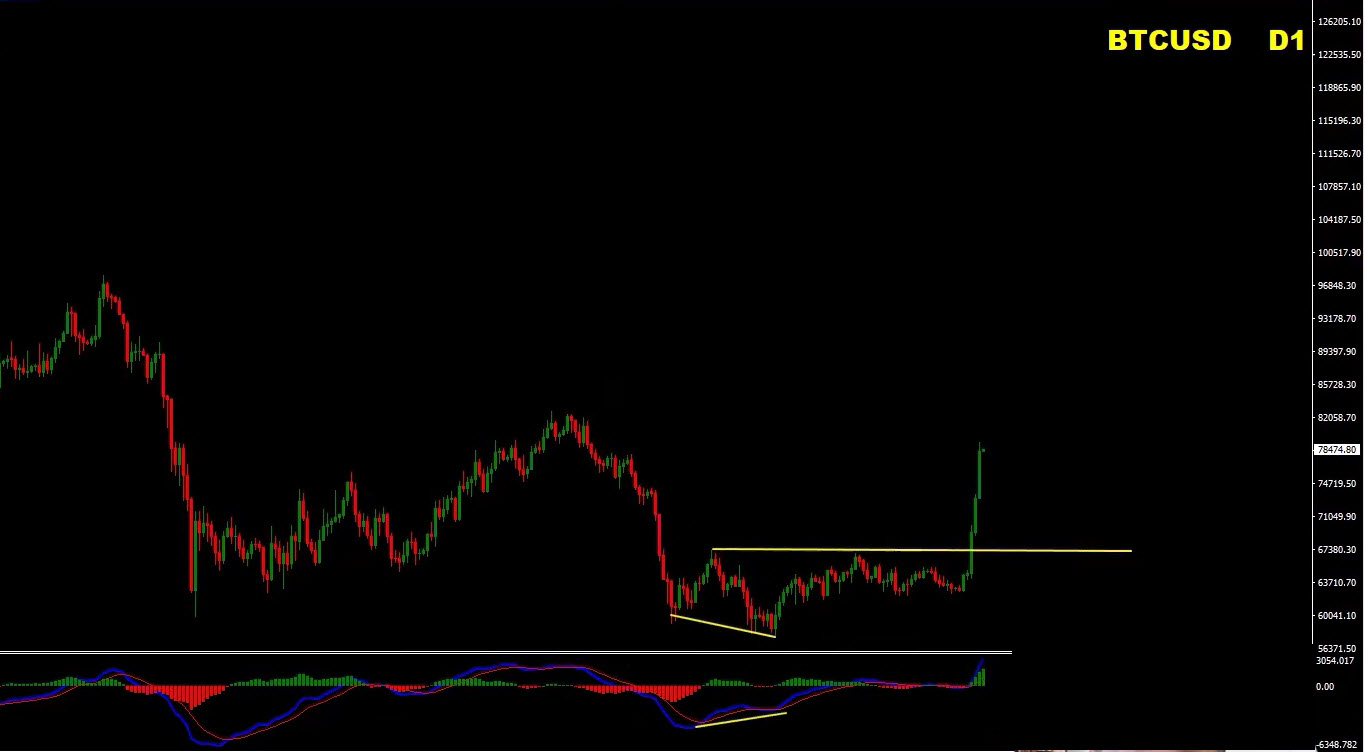
- Higher highs
- Higher lows
- Improving momentum
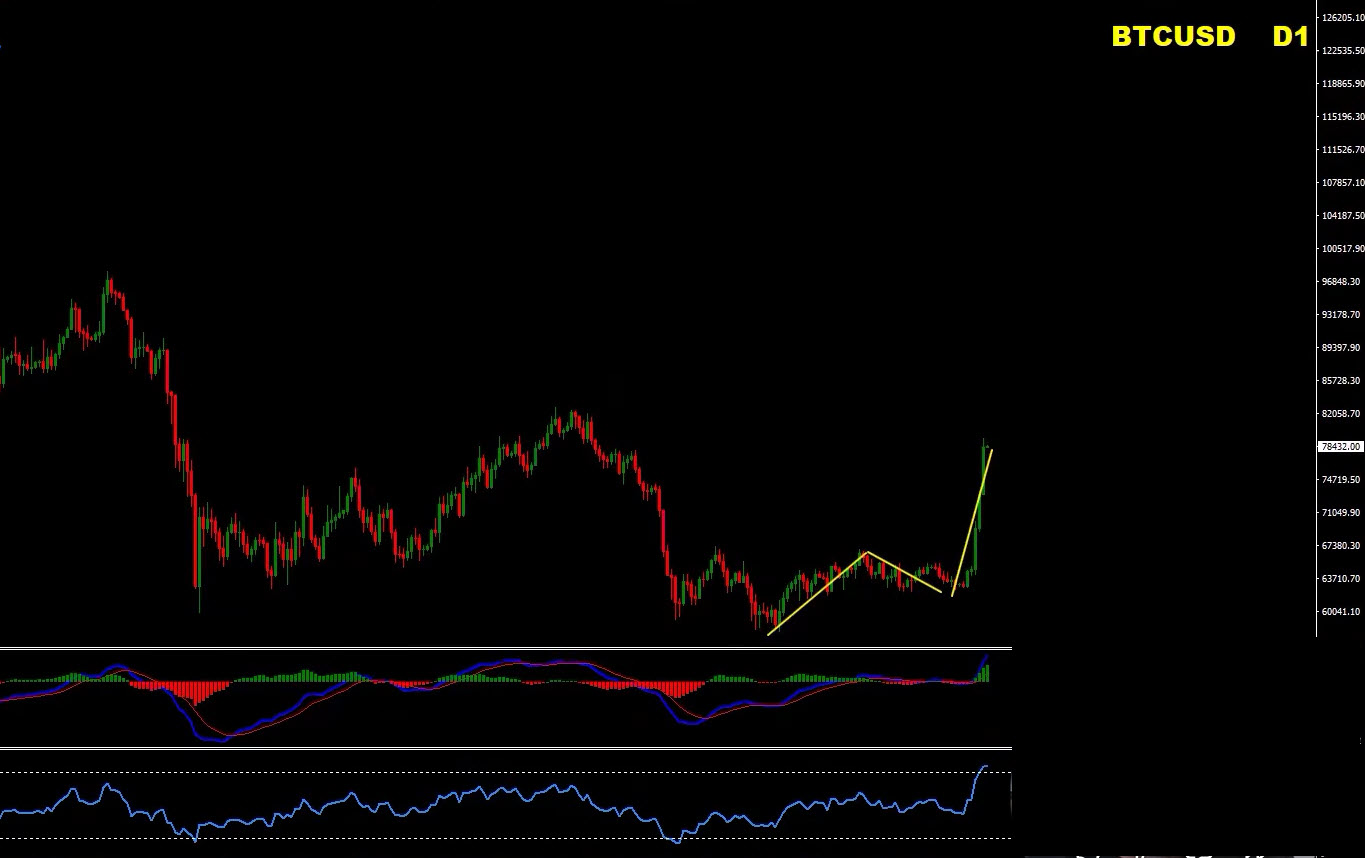
This is encouraging.
But I still believe we need to remain realistic.
Bitcoin Technical Outlook
The first bullish move following a divergence does not automatically mean we are already entering a new all-time-high rally.
It is possible.
But I want more evidence.
On the shorter timeframe, RSI has become relatively strong.
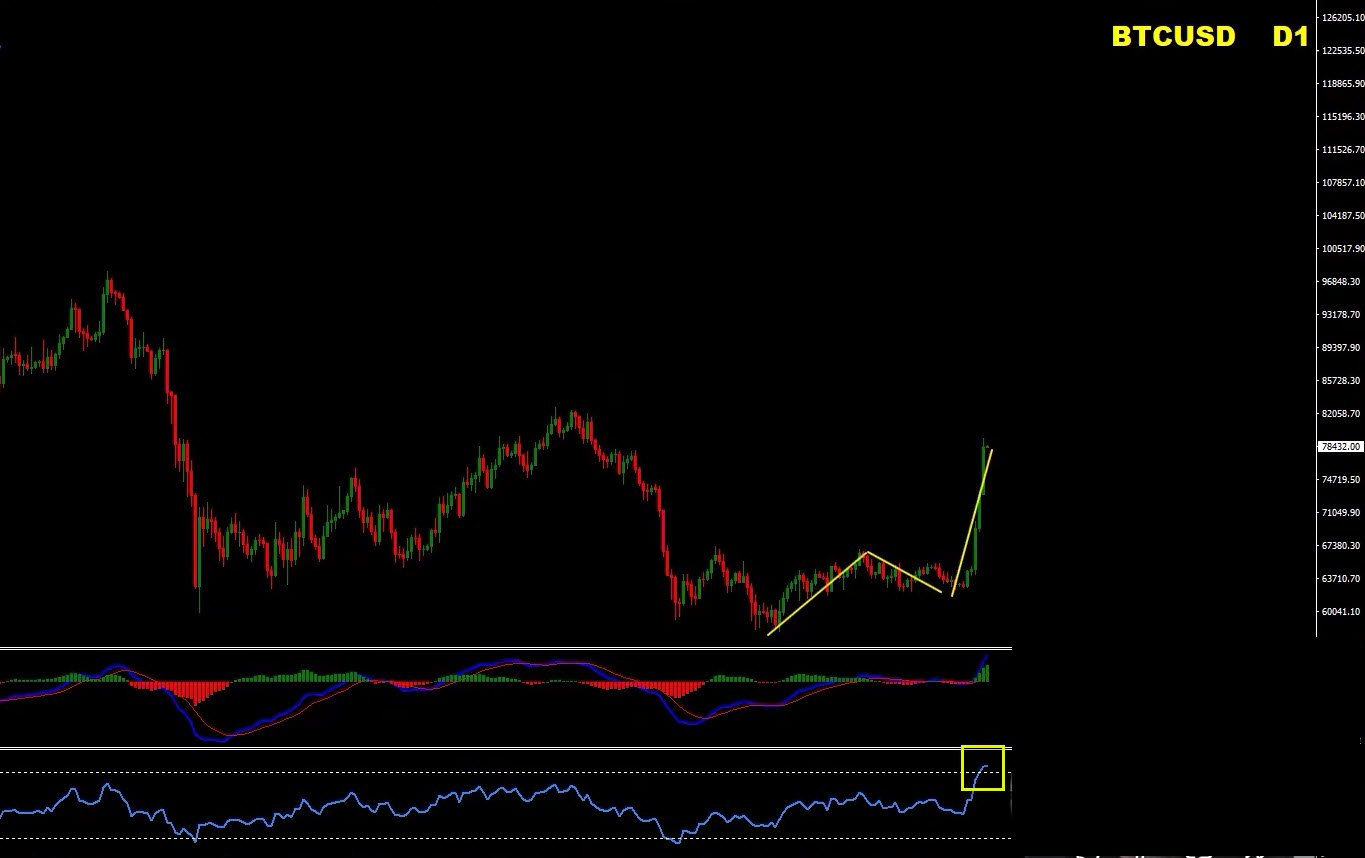
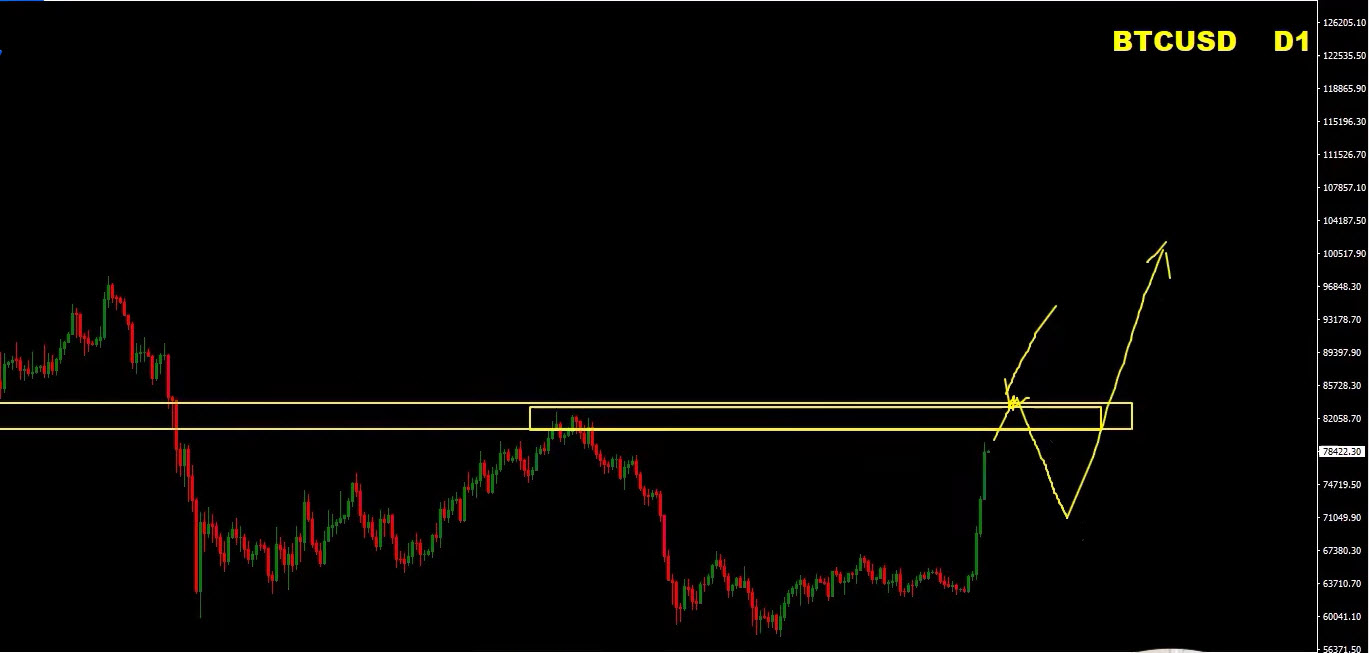
Bitcoin is approaching an important area where previous support can now become resistance.
This gives us a very interesting setup.
Key Bitcoin Support Area
The area I am watching is approximately:
80,000–85,000
This region could become important support.
If Bitcoin pulls back into this area and buyers appear, I would look for another bullish wave.
The basic idea is:
Pullback → Support → Bullish confirmation → Buy the dip
Bitcoin Upside Targets
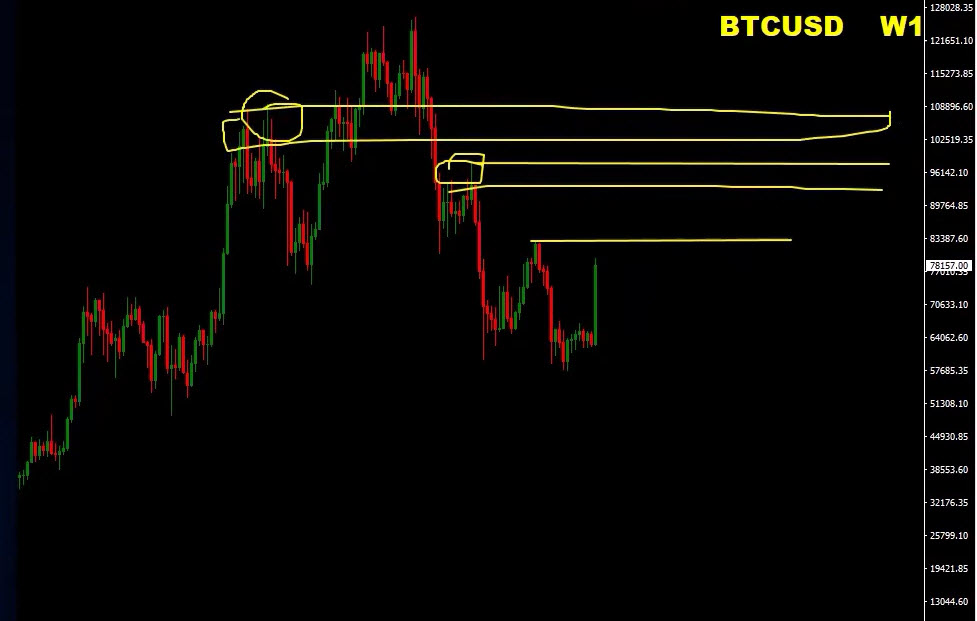
The first major area I expect Bitcoin to challenge is around:
95,000–97,000
If Bitcoin successfully clears that area, the next major target comes from the higher-timeframe structure around:
105,000–110,000
That would put Bitcoin much closer to the previous major highs.
Is Bitcoin Starting Another Bull Run?
This is where I want to remain cautious.
Could Bitcoin eventually move toward new all-time highs?
Absolutely.
But right now, I do not believe we have enough evidence to make that conclusion with confidence.
This is still the first major bullish move following the recent bullish divergence.
I want to see how price behaves around the next resistance levels.
If Bitcoin continues creating higher highs and higher lows while holding the dynamic support structure, the bullish case becomes stronger.
Bitcoin Trading Plan
For now, my preferred strategy remains:
Buy the dips.
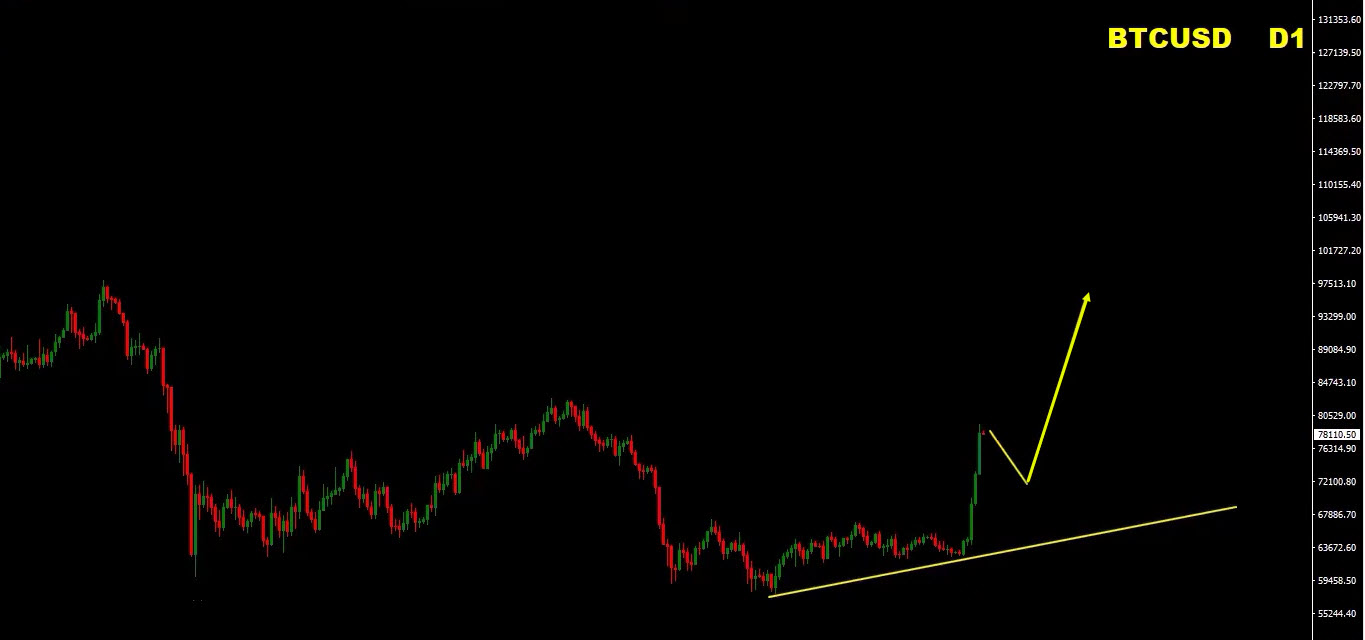
Watch the dynamic support line closely.
As long as that structure holds, pullbacks could provide opportunities to participate in the next bullish move.
Potential targets:
95,000–97,000 → 105,000–110,000
But remember:
Do not chase Bitcoin after a strong impulsive move.
Wait for the market to give you a better entry.
Bitcoin Trading Bias
Short-term bias: Bullish
Key support: 80,000–85,000
Upside targets: 95,000–97,000 and potentially 105,000–110,000
Strategy: Buy the dips while the bullish structure remains intact.
Pro Trading Tip
One of the biggest mistakes traders make is trying to predict the entire move.
You don’t need to.
You don’t need to know whether Gold will definitely reach 5,000.
You don’t need to know whether Bitcoin will definitely reach 110,000.
You don’t need to know whether EUR/USD will definitely reach 1.2000.
Your job is to identify the important areas and then wait for the market to confirm what it wants to do.
If price reaches resistance but there is no bearish confirmation, don’t force the sell.
If price reaches support but buyers do not appear, don’t force the buy.
Let the market confirm your idea.
Use the higher timeframe to identify the important zones.
Use the lower timeframe to identify the entry.
And always manage your risk.
Remember:
The level gives you the location.
The structure gives you the direction.
The confirmation gives you the entry.
That is the approach I will continue to follow this week.
 Join the Home Trader Club
Want to access the tools, systems, and real-time education we use daily?
With AvaTrade Broker’s support, you can now enjoy up to one full year of access to the Home Trader Club — including:
-
All professional trading systems
-
Access to our new project, the Home Trader Club trade copier, where our traders trade and you can copy.
-
Real-time trade ideas and setups
-
Full access to our course library and trading marketplace
 Join here: https://tracking.avapartner.com/dR0AAA
Wishing you a profitable week ahead!
Vladimir Ribakov
Internationally Certified Financial Technician
Home Trader Club