Every single trader out there went through a phase in his career where the dream of predicting the markets was crushed in small pieces.
Maybe there are such “units” somewhere but as far as I know such thing doesn’t exist. And here might come the confusion – how do you make money then?
There is a difference between predicting the price movement 100% of the times and analyzing then trading the statistical odds, using tools to have an edge, risking less than your potential reward etc.
Is predicting and analyzing related to certain extend? Definitely! Coming to thing about it, this small difference is probably the gap between profitable and losing traders.
So why i’m talking about predictions?
It has been on my agenda for some time, to present to my readers the mighty GANN theory. It is an absolutely fascinating study by William Delbert Gann which for some reason is not as popular as you might think.
William Delbert Gann (1878 – 1955)
WD Gann’s life story is very colorful and compelling. Born in Texas in farmers family, he started trading when he was 24 (1902).
It is a known fact (mainly through his books) that he was a religious man but also interested in science. His rich knowledge of ancient mathematics as well as Greek and Egyptian cultures was most likely acquired due to the fact he was a Freemason of the Scottish Rite Order.
Gann developed many tools such as Gann angles, Square of 9, Hexagon, Circle of 360. His analysis are based on ancient mathematics, astrology, astronomy and geometry. Very wide range of methods which in my opinion explains why the gap between the critics who admire his work, and the ones that are strongly against it, is wide.
Early Predictions
He is famous for many but probably one of the most distinguishing ones is during the World War I, when Gann predicted the abdication of the Kaiser on November 9th, 1918 which was the end of the war.
According to many he also forecasted the Japanese attack on Pearl Harbor which started the air war between the two countries, in his book from 1927 “Tunnel Through The Air”. Right or wrong I will leave it to you to judge.
When it comes to financial forecasts he predicted the continuation of the rally in 1929 due to speculations and that the market will reach new high – until early April.
Gann published his daily forecast “The Supply and Demand Letter” where he would analyze commodities and stocks.
In a while when his newsletter picked up more and more readers, he issued several books. “Truth” which was featured in the Wall Street Journal turns out to be one of his best works.
This is when he released to the public his trading methods, knows as the Gann Studies.
GANN Studies a.k.a. GANN Theory
The GANN theory is basically the correlation between patterns, price and time and how all three relate to the market. According to GANN those are the 3 most valuable aspects of trading that could best describe and predict the future movements of the markets.
Any of these 3 elements could provide a signal on its own but according to the GANN theory if you are patient enough, to wait for all three to “tell” you the same thing, your odds will tremendously increase.
This is exactly what happened in the early years of Gann’s trading career when he found “the market time factor”. The year was 1908, Gann opened two accounts ($300 and $150) to test out his new findings and strategy.
In only one month he managed to turn the $150 into $12,000 and the $300 brought him a profit of $25,000 in a quarter. These achievements gained him the respect of Wall Street, making him one of the pioneers of technical analysis as well as one of the best analysts!
Fascinating, isn’t it?
Mathematics in GANN Theory
As it was already mentioned above, Gann had a huge passion for numbers and mathematics. He applied his knowledge towards finding patterns in the market, and judging by his results, he found the correlation.
The square of numbers for example, plays a significant role in his trading and analysis. The numbers, that he believed are really important are : 16, 25, 36, 49, 64, 121 and 144.
As per his understanding, the market would move in patterns that was strongly correlated to this numbers and their squares. For example a specific rally might find strong resistance 64 cents or 64 days from the bottom.
Key Numbers in GANN Theory
Some of the numbers that Gann would use in his analysis: 12 (it has biblical and astrological meaning – 12 disciples, 12 houses of the zodiac), 3.5, 144 and 365.
Breaking down GANN Theory
Looking back at his way of thinking, I can only admire the way his brain worked. He managed to figure out 100 years ago, that the market is a complex creature and we can’t and shouldn’t try to predict it, looking at it from only one angle.
He generalized the market as a whole, defined the main factors that are making it move, and tried to look at each factor independently. Once all three factors agreed, he would make his move. Brilliant!
- Price study– This uses support and resistance lines, pivot points and angles.
- Time study – This looks at historically reoccurring dates, derived by natural and social means.
- Pattern study – This looks at market swings using trendlines and reversal patterns.
It is like driving a car. Weather is factor 1, proper tiers for the season is factor 2, driving after you have been drinking is factor 3.
So if it winter, and temperature is -15, road is all covered in ice, you better wait until you get your winter tires and until you sober up.
If you are not patient enough, you might and will probably end up on the side of the road after a few turns. To make this journey successful you should have all three factors lined up to achieve best results.
Best is to wait a bit until sun comes up, ice melts, you have your winter tires setup, you are sober and well relaxed after a good sleep as opposed to driving drunk, with summer tires in the middle of the night.
Same goes in trading, if you have the patience, you might turn pretty much the same situation, from total disaster into huge profits.
GANN Angles (vs Trend lines)
Of all of W.D. Gann’s trading techniques available, drawing angles to trade and forecast is probably the most popular analysis tool used by traders.
Many traders still draw them on charts manually and even more use computerized technical analysis packages to place them on screens.
Because of the relative ease traders today have at placing Gann angles on charts, many traders do not feel the need to actually explore when, how and why to use them.
These angles are often compared to trendlines, but many people are unaware that they are not the same thing. (To learn about trendlines, see Track Stock Prices With Trendlines.)
A Gann angle is a diagonal line that moves at a uniform rate of speed. A trendline is created by connecting bottoms to bottoms in the case of an uptrend and tops to tops in the case of a downtrend.
The benefit of drawing a Gann angle compared to a trendline is that it moves at a uniform rate of speed. This allows the analyst to forecast where the price is going to be on a particular date in the future.
This is not to say that a Gann angle always predicts where the market will be, but the analyst will know where the Gann angle will be, which will help gauge the strength and direction of the trend.
A trendline, on the other hand, does have some predictive value, but because of the constant adjustments that usually take place, it’s unreliable for making long-term forecasts.
Constructing Gann Angles
Before we begin, it is important to realize that this form of analysis – like most forms of technical analysis – is not set in stone but constructed out of empirical methods. Without further ado, here is the process used to construct a Gann angle:
- Determine the time units – This is one of the empirical processes. One common way to determine a time unit is to study the stock’s chart and take note of distances in which price movements occur. Then, simply put the angles to the test and determine their accuracy. Most people use intermediate-term (such as one to three-month) charts for this as opposed to long-term (multi-year) or short-term (one to seven-day) charts. This is because, in most cases, the intermediate-term charts produce the optimal amount of patterns.
- Determine the high or low from which to draw the Gann lines – This is the second empirical process, and the most common way to accomplish it is to use other forms of technical analysis–such as Fibonacci levels or pivot points. Gann himself, however, used what he called “vibrations” or “price swings.” He determined these by analyzing charts using mathematical theories like Fibonacci.
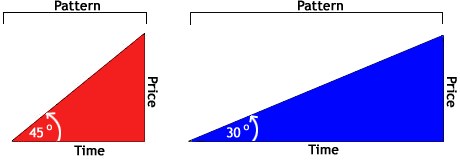
- Determine which pattern to use – The two most common patterns are the 1×1 (left figure above), the 1×2 (right figure above), and the 2×1. These are simply variations in the slope of the line. For example, the 1×2 is half the slope of the 1×1. The numbers simply refer to the number of units.
- Draw the patterns – The direction would be either downward and to the right from a high point, or upward and to the right from a low point.
- Look for repeat patterns further down the chart – Remember this technique is based on the premise that markets are cyclical.
Again, this requires some fine-tuning with experience in order to perfect. Because of this, the results will vary from person to person. Some people, like Gann, will experience extraordinary success, while others – who don’t use such refined techniques – will experience sub-par returns.
However, if the system is followed and sufficient research is put into finding the optimal requirements, above-average returns should be attainable. But remember, technical analysis is an odds game -add more technical indicators to increase your chances of a successful trade.
Using Gann Angles
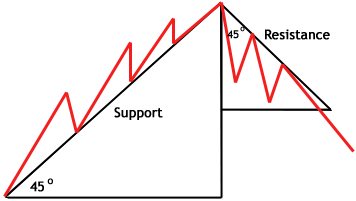
Gann angles are most commonly used as support and resistance lines. But many studies have support and resistance lines. What makes this one so important? Well, Gann angles let you add a new dimension to these important levels – they can be diagonal.
 |
Here you can see how Gann angles can be used to form support and resistance levels. Diagonal trend lines are commonly used to determine times to add to existing long positions, to determine new lows and highs (by finding significant breaks of the trend line), and to help discern the overall trend.
Sources and references: Wikipedia, Investopedia, StockCharts


I would appreciate it if you would remove my art work that you obtained from the cover of my book, W.D. Gann: Divination By Mathematics: Harmonic Analysis.
Hi
Not sure I understand what you mean? Please email me to vladimir.ribakov@gmail.com so we can solve all there
Thank you!
Hello Awodele
I am a big fan of your work.
I bought all your books.
Is there any new one in the works?
Many thanks.
You can put the art work back the way you had it… Awodele is no longer with us.
Excellent theory, well explained