Look for sell opportunities in USDJPY

0
651

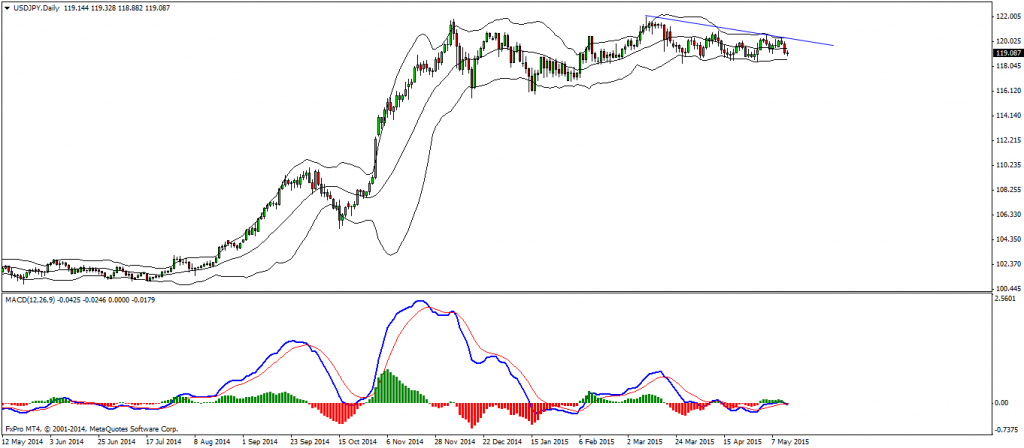
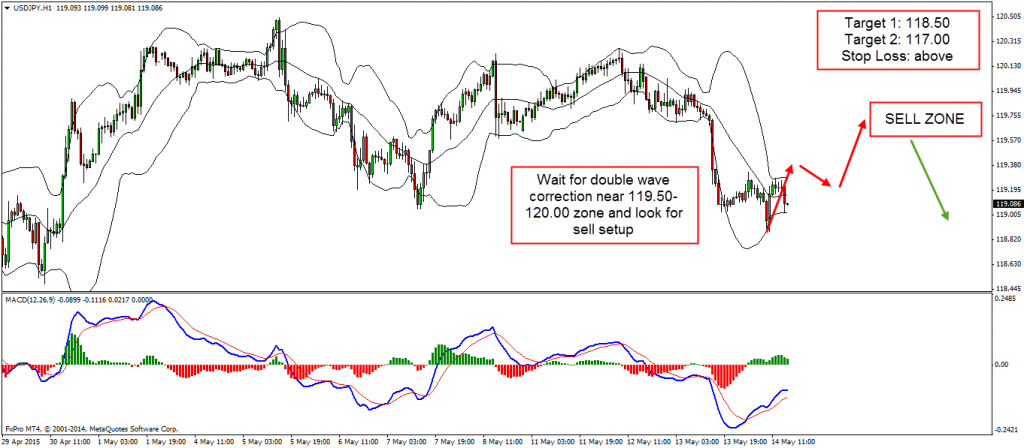
Even though this pair is inside a range on the daily chart we can still enjoy from it on the lower time frames. Looking at the daily chart closely, we can see that the down trend line is well respected and the pair is still making lower highs. So if we get double wave correction to the upside near 119.50 – 120.00 zone we can look for sell opportunities.

Technical Analysis:

D1 – bearish trend line

USDJPY-D1-1024x448
Entry:

H1 – look for double wave correction up near the daily down trend line. Levels to follow are 119.50 up to 120.00 zone. Ideally we will also get hidden bearish divergence.
Target 1: 118.50
Target 2: 117.00
Stop Loss: above 120.30

USDJPY-H1-1024x448

Video Explanation:

Yours,
Vladimir

Previous articleLook for buy setups after the break of the triangle in AUDUSD
Next articleSell rallies in EURGBP
Following 11+ years of trading experience, trading my own accounts as well as for hedge funds and brokerages, I have decided to fulfill my destiny and to personally mentor Forex and Commodities traders. When I released the “Broker Nightmare” (software that hides trades from brokers) 8 years ago, I found an overwhelming number of frustrated people who genuinely wanted to learn how to trade the Forex market, but instead found themselves scammed and misled. Over the years I have also release other trading systems based on my trading strategies, and met a lot of people on my worldwide Forex seminars. We’ve formed a close Forex community and we meet once or twice a year in various locations in Europe.
Subscribe
Notify of
guest

0 Comments
Newest
Oldest Most Voted
Inline Feedbacks
View all comments