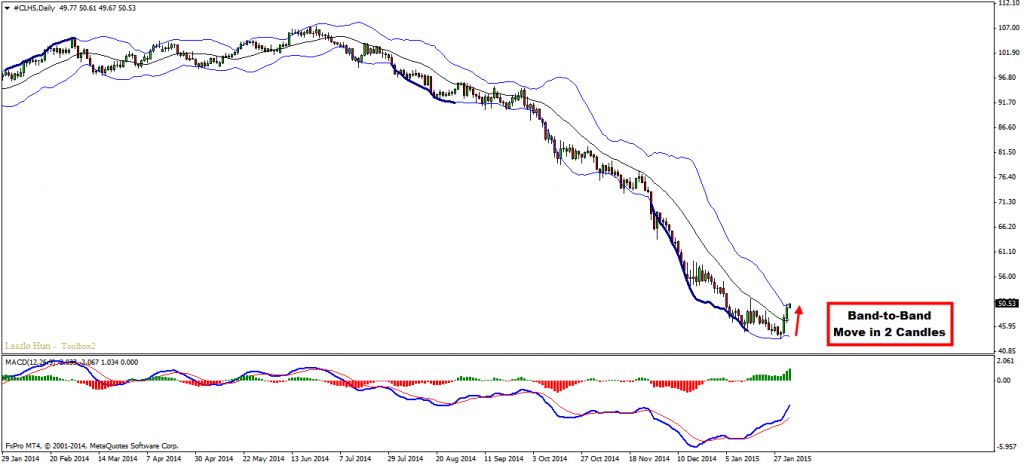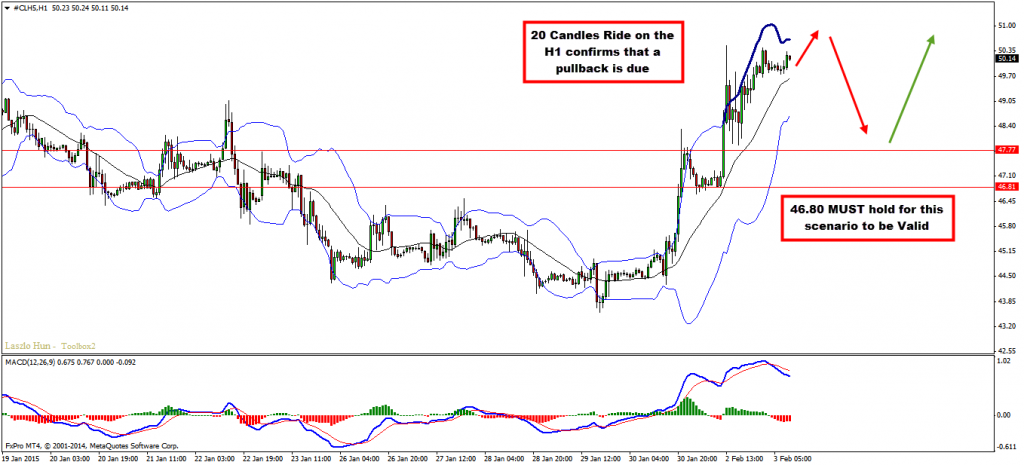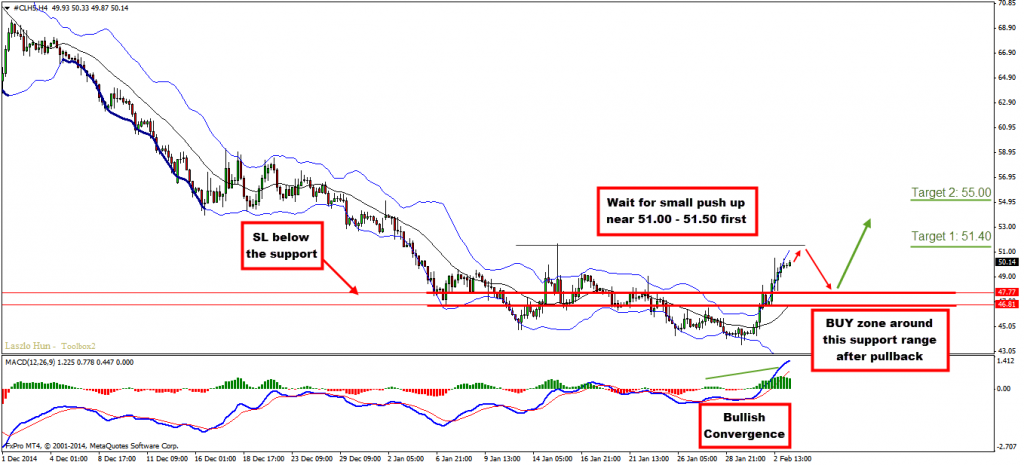
Looks like bulls are trying to get on top. We see a clear band to band move in the daily chart. On the H4 chart bullish convergence has formed (see MACD) which is another technical sign that the commodity is getting ready for further up moves. Ideally Oil will push a but higher around the last high near 51.00 – 51.50 and than go for the correction. On the H1 chart we already have more than 20 candles ride on the Bollinger Bands which confirms our trading plan. In summary – wait for another push towards 51.00-51.50 followed by correction to the support zone around 47.80 – 46.80 range and look for buy opportunities. Bullish hidden divergence along with bullish candle pattern would be ideal around the mentioned support.
Technical Overview:
D1 – Band-to-Band move
Entry:
H1 – Ideally we will see another small push near the last H4 high before a deeper correction
near 47.80 – 46.80 and then look for bullish hidden divergence triggered by bullish candle pattern close to the support range.
Target 1: 51.40
Target 2: 55.00
Stop Loss: below 46.80
Video Explanation
Have a wonderful rest of the week!
Yours,
Vladimir


