




The Forex and commodities markets are entering an interesting phase, with renewed inflation concerns, expectations of further interest rate hikes, and significant technical developments across major currency pairs and gold.
Could EUR/USD extend its decline toward 1.11, 1.10, or even 1.08? Is USD/JPY preparing for another major bearish move? Could gold recover toward 4,800–5,000 before resuming its longer-term decline?
And what about NZD/USD? Could the current technical setup provide an opportunity to buy the dip?
In this week’s Forex forecast, I will break down the latest market developments, analyze the key technical levels, and explain the trading scenarios I am watching.
- 1 Trade with AvaTrade and Unlock Unlimited Home Trader Club Access
- 2 Watch the Full Weekly Forecast Video
- 3 Forex Weekly Forecast: Fundamental Market Outlook
- 4 EUR/USD Forecast: Is a Move Toward 1.08 Possible?
- 5 USD/JPY Forecast: Bearish Divergence Across Higher Timeframes
- 6 NZD/USD Forecast: A Potential Buy-the-Dip Opportunity
- 7 Gold Forecast: Could Gold Recover Toward 5,000 Before Another Decline?
- 8 Final Thoughts: What Is the Most Interesting Trading Opportunity This Week?
- 9 Join the Home Trader Club
- 10 Risk Disclaimer
Trade with AvaTrade and Unlock Unlimited Home Trader Club Access
We have partnered with AvaTrade, one of the industry’s leading regulated brokers.
When you open and trade with AvaTrade through our partnership, you receive:
- Unlimited access to Home Trader Club
- Real-time trading education
- Daily and swing trading opportunities
- Our complete educational library
- Access to our Trade Copier Project
- Members-only trading community
If you’re looking to accelerate your trading journey while enjoying premium education, this partnership gives you everything you need under one roof.
If you already have account with them, still follow this link to open separate account with separate email. Once you did that, contact me with the telegram link below and we will give you the access.
 Watch the Full Weekly Forecast Video
Forex Weekly Forecast: Fundamental Market Outlook
The Federal Reserve and other major central banks have brought interest rate hikes back into focus. Inflation remains a significant concern, while geopolitical tensions continue to create uncertainty across global financial markets.
According to the economic outlook discussed in this week’s analysis, the Federal Reserve’s latest decision was a rate hike to a range of 3.75%–4%.
The immediate market reaction was relatively clear:
- The US dollar strengthened.
- Gold came under pressure.
- Stock markets declined.
- Treasury yields moved higher.
The main question now is whether inflation will remain elevated and force central banks to maintain their restrictive monetary policies.
What Could Happen Next?
There are two major scenarios to consider.
Scenario 1: Inflation Remains Elevated
If inflation continues to stay high, further interest rate hikes could remain on the table.
Under this scenario, the US dollar and Treasury yields could remain supported, while stocks and gold could face additional selling pressure.
Scenario 2: Inflation Begins to Cool
If inflation starts to decline, central banks could postpone or cancel additional rate hikes.
In that case, some of the recent US dollar strength could fade, potentially allowing currencies such as EUR/USD to recover and providing relief for gold and equities.
The key takeaway is that the fundamental outlook remains sensitive to inflation data, central bank decisions, and geopolitical developments.
For traders, this means we need to combine the fundamental picture with technical analysis rather than rely on a single market narrative.
EUR/USD Forecast: Is a Move Toward 1.08 Possible?
EUR/USD Trading Bias: Bearish – Looking to Sell the Rallies
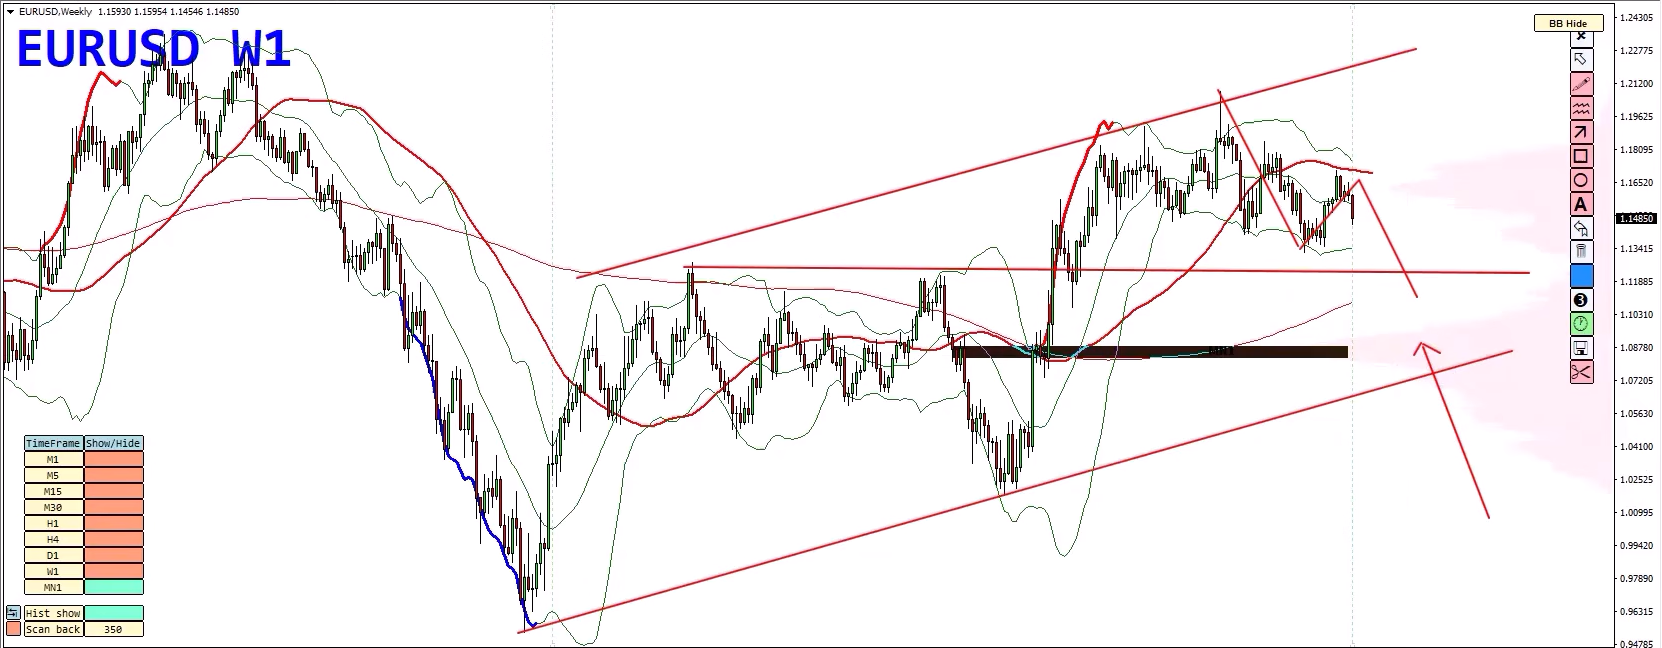
The EUR/USD chart continues to show bearish pressure, and I believe there is still room for another downward move.
The first area I am watching is around 1.11, where previously broken weekly resistance could now act as support.
If the selling pressure continues and this area fails to hold, the next major zone comes around 1.08–1.09.
This area is particularly interesting because it coincides with the lower boundary of the rising channel and a significant volume profile zone.
Key Technical Factors
- Previously broken weekly resistance acting as potential support.
- The lower boundary of the rising channel around 1.08–1.09.
- A significant volume profile area around the same region.
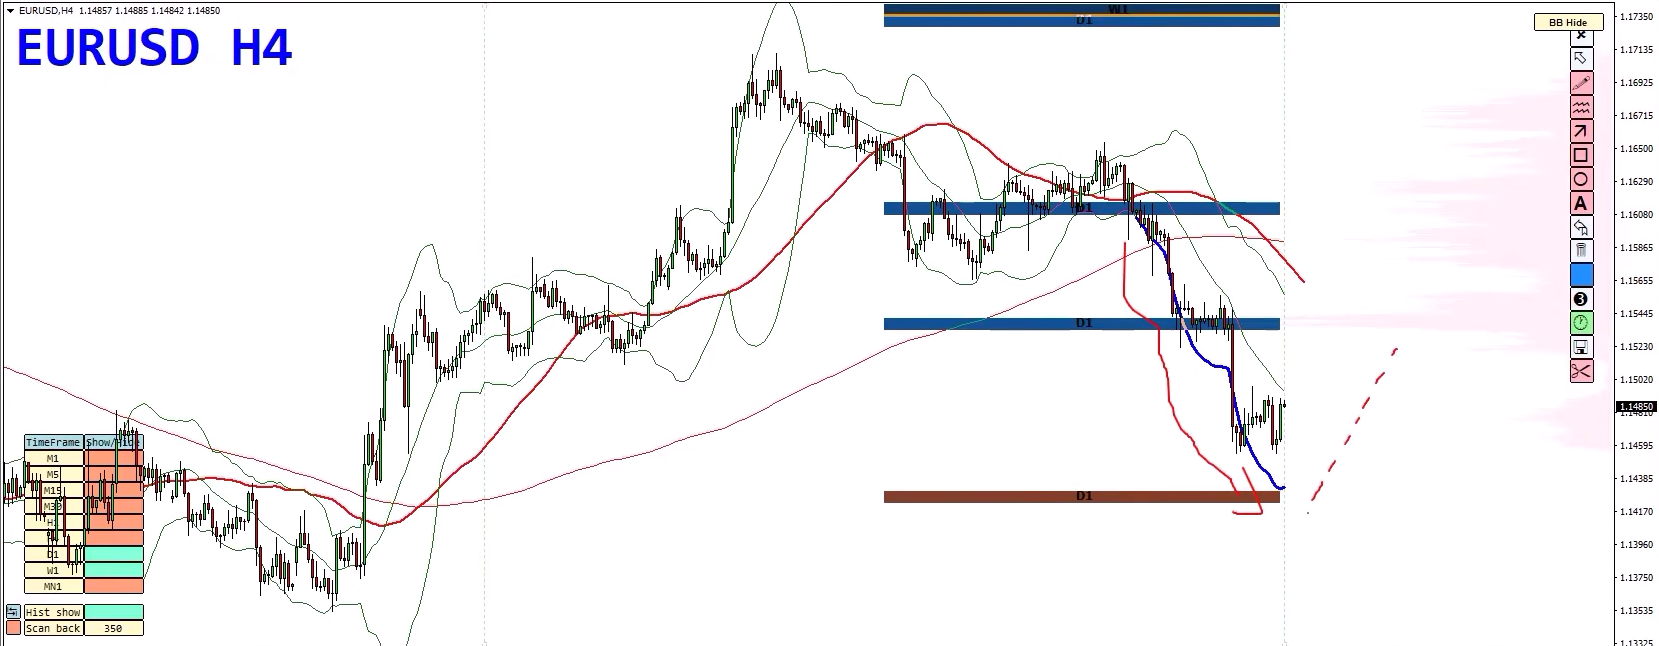
- Price action pressing against the lower Bollinger Band.
One important detail is that EUR/USD is currently riding along the lower Bollinger Band.
This can indicate strong bearish momentum, but it can also signal that a temporary slowdown or pullback may develop.
Could a Bullish Divergence Trigger a Recovery?
I am also watching for a potential bullish divergence on the lower timeframes.
A bullish divergence occurs when price forms lower lows while an indicator, such as MACD, forms higher lows.
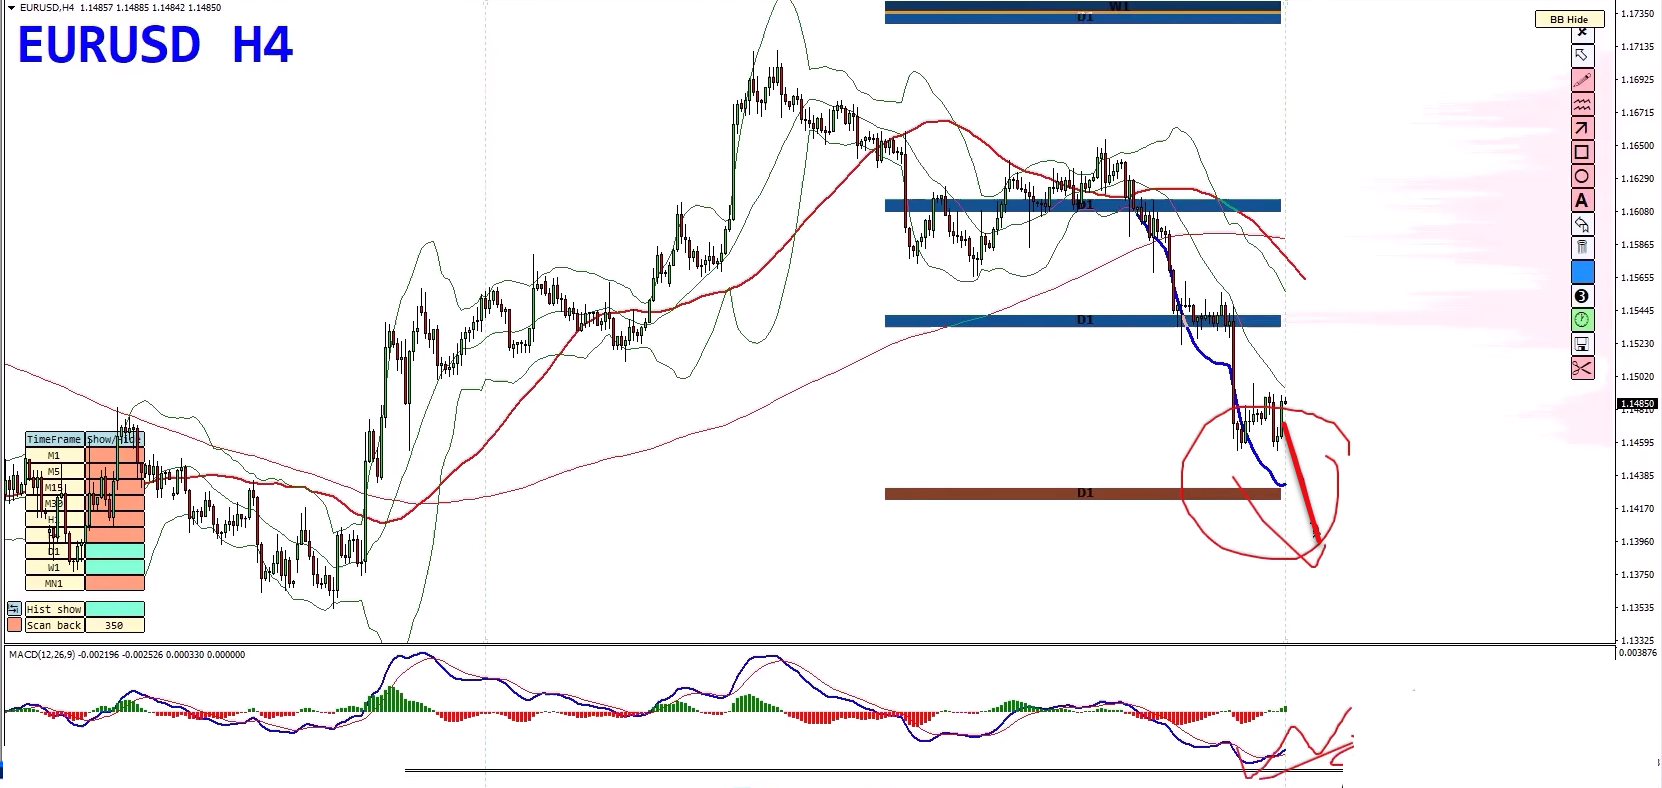
If this pattern develops and receives confirmation from price action, we could see a temporary recovery.
The next important upside area is the volume profile zone above 1.1520, with a possible extension toward 1.16.
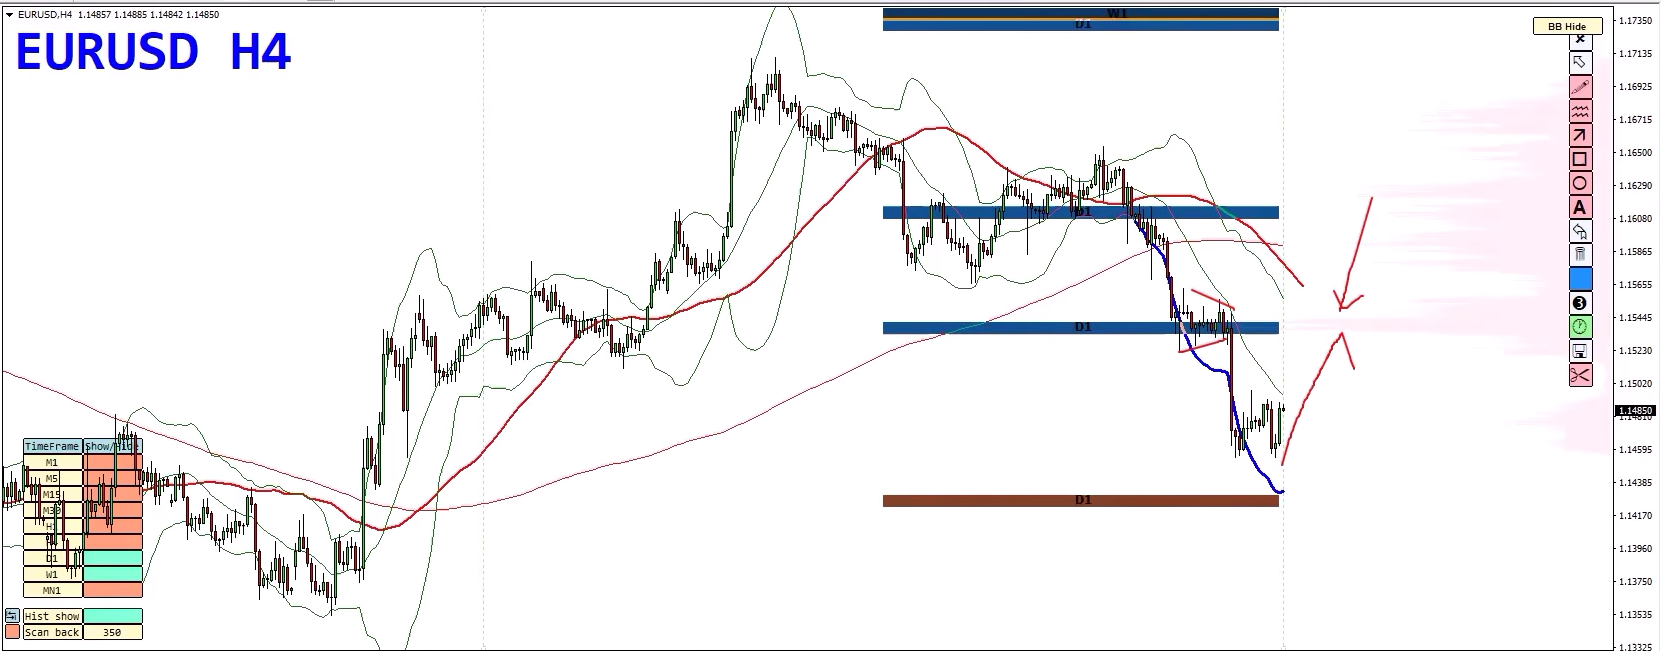
However, a recovery toward these levels would not automatically invalidate the broader bearish structure.
EUR/USD Trading Plan
My preferred approach is to look for selling opportunities during temporary rallies.
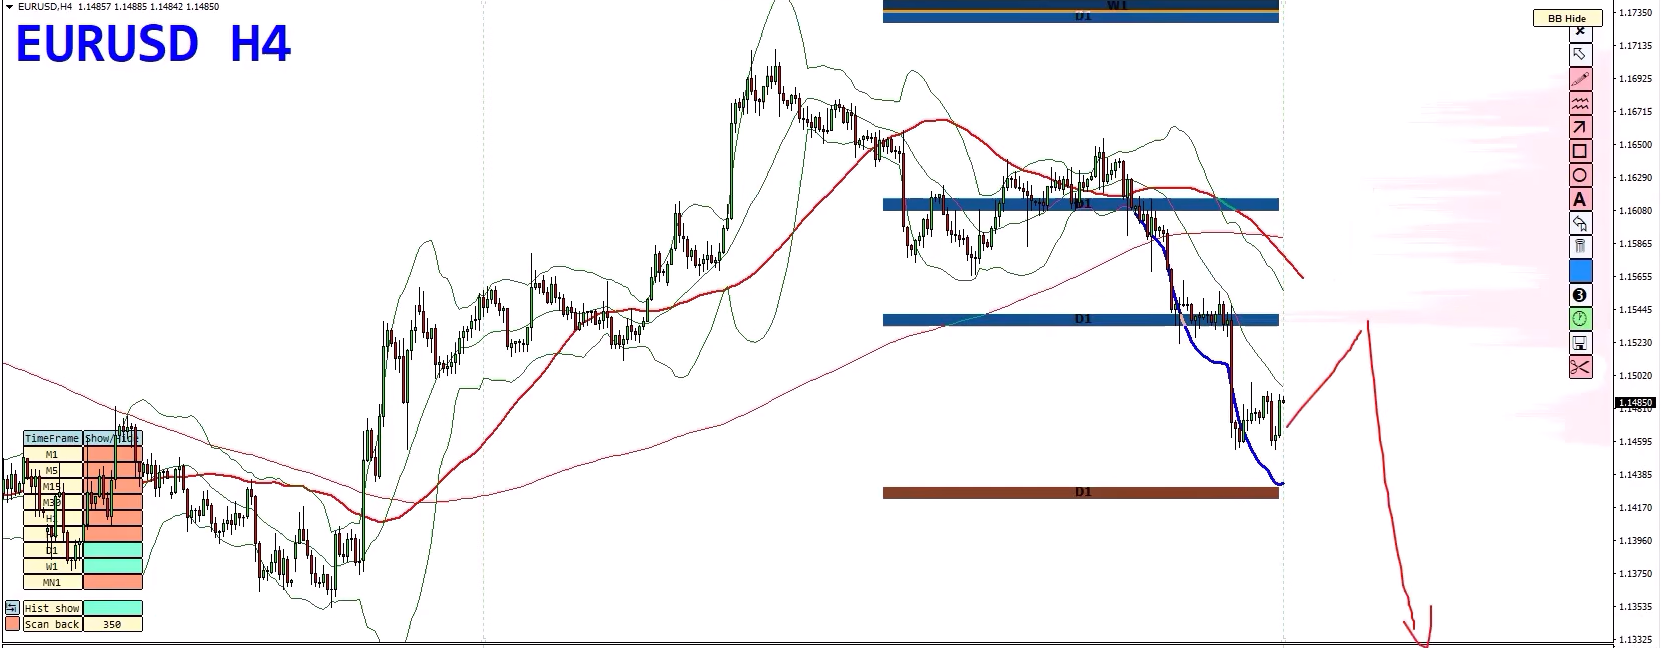
If price reaches a resistance area and bearish confirmation develops, that could provide a potential opportunity to join the prevailing bearish move.
At the same time, I would avoid chasing price directly into major support. A confirmed reversal or pullback could provide a more structured entry.
EUR/USD levels to watch:
| Price Area | Technical Significance |
|---|---|
| 1.11 | Potential support / previous weekly resistance |
| 1.08–1.09 | Rising channel support and major volume profile |
| Above 1.1520 | Potential recovery and volume profile retest |
| 1.16 | Possible upside extension |
USD/JPY Forecast: Bearish Divergence Across Higher Timeframes
USD/JPY Trading Bias: Bearish – Looking for Selling Opportunities at Resistance
USD/JPY is another interesting market this week.
The monthly and weekly charts are showing a bearish divergence pattern, which deserves close attention.
On the monthly chart, price has formed higher highs, while MACD and RSI have formed lower highs.
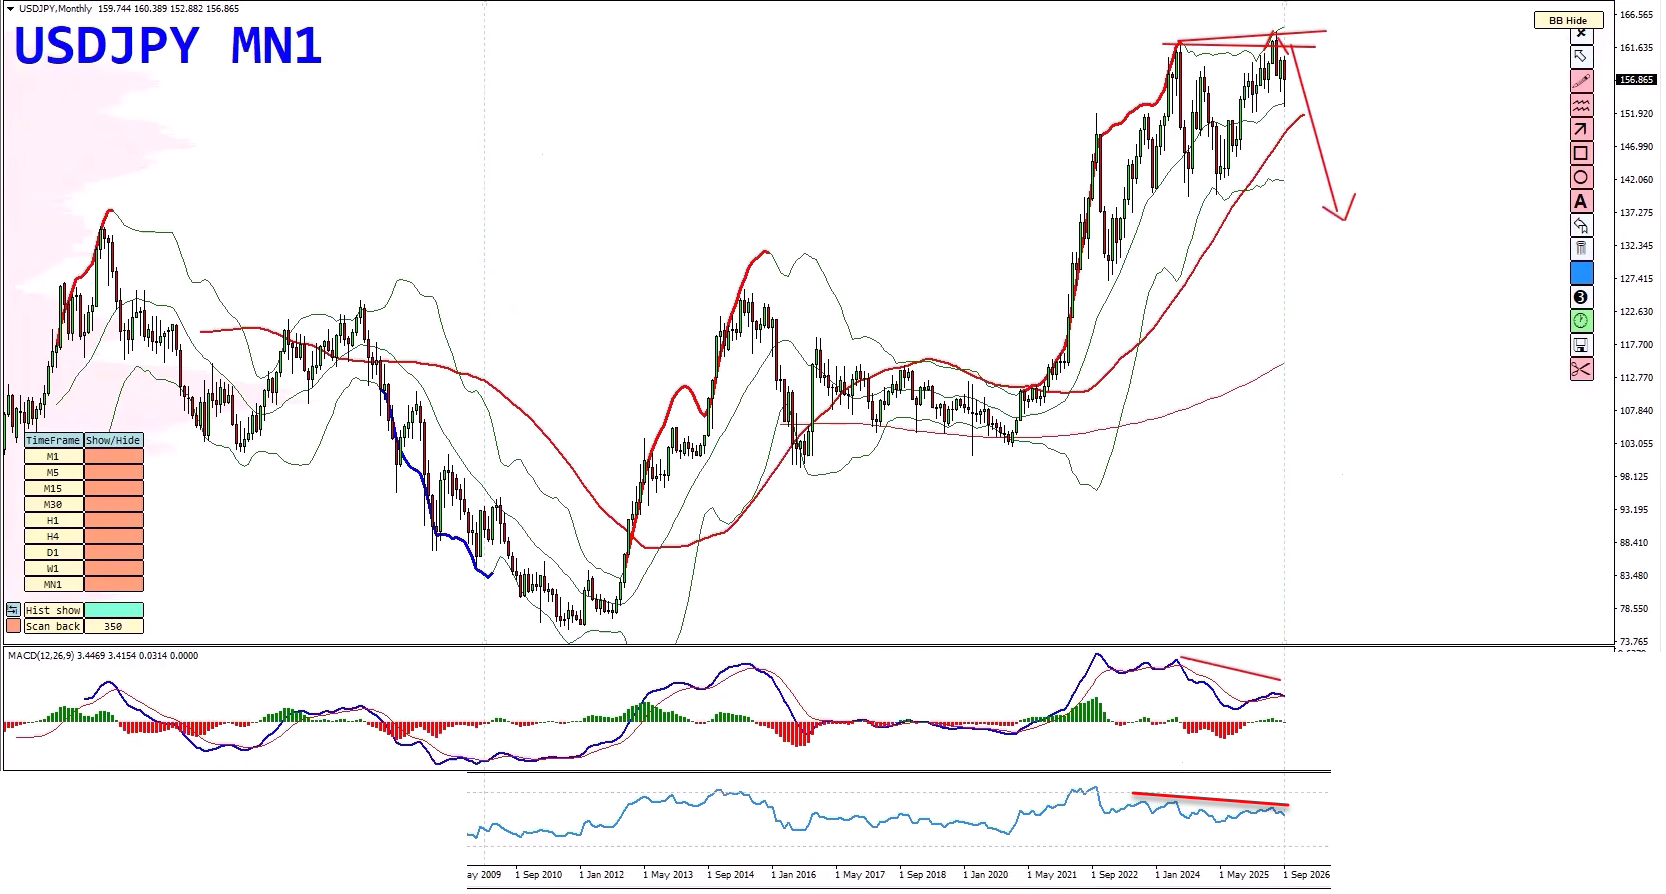
This is a classical bearish divergence condition.
A similar pattern is visible on the weekly chart.
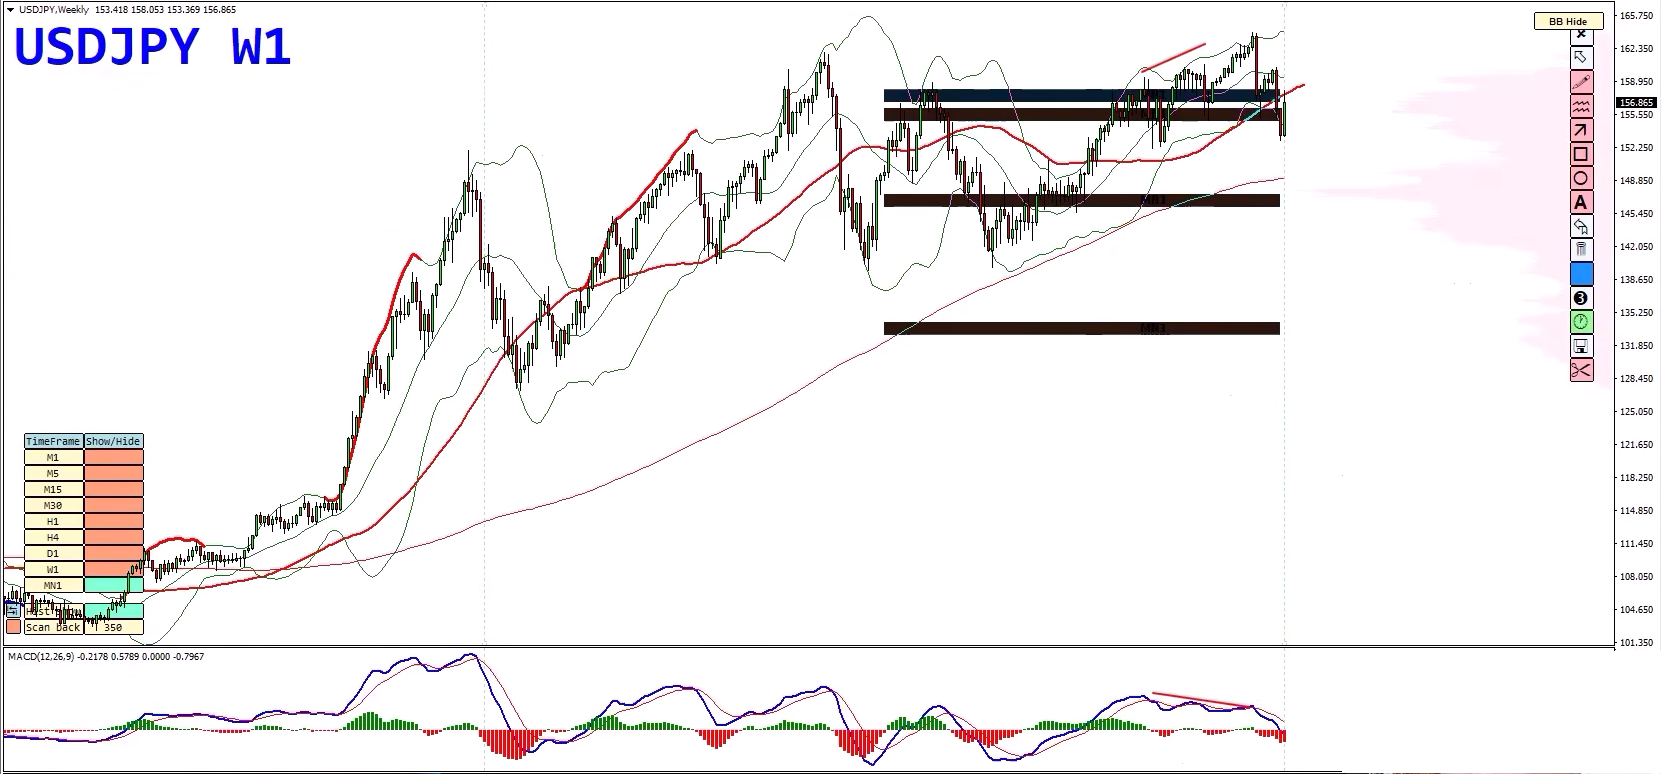
Bearish divergence does not guarantee an immediate reversal, but it can provide an important warning that the existing bullish momentum is weakening.
Monthly and Weekly Technical Analysis
The higher-timeframe charts are suggesting that USD/JPY could be approaching an important turning point.
A false breakout or failed move toward new highs would add further evidence that the market may be preparing for a deeper correction.
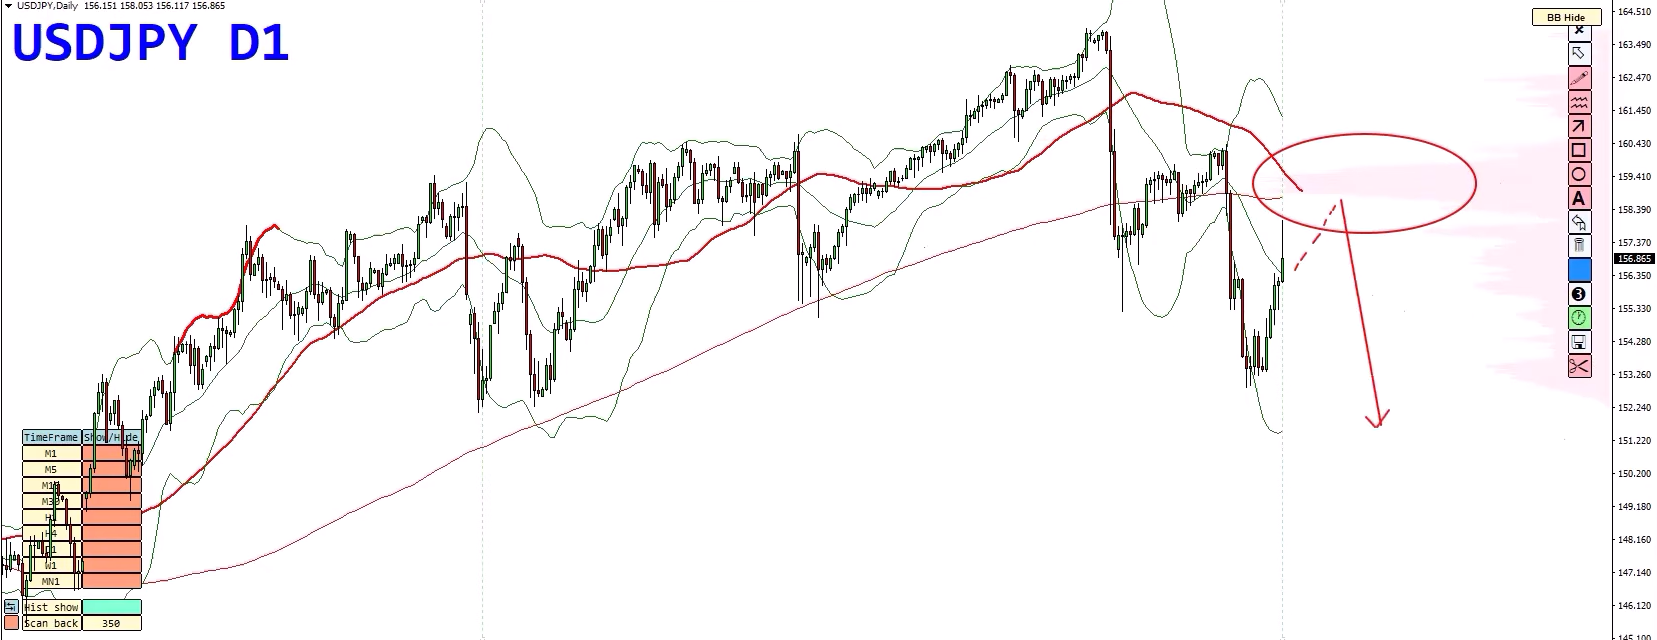
On the daily chart, we have already seen two bearish waves developing.
The next question is where the market could find resistance if it attempts another recovery.
The Key USD/JPY Resistance Zone
The major resistance area discussed in this analysis is around 158.00–161.00, with particular attention to the 158.00–160.00 region.
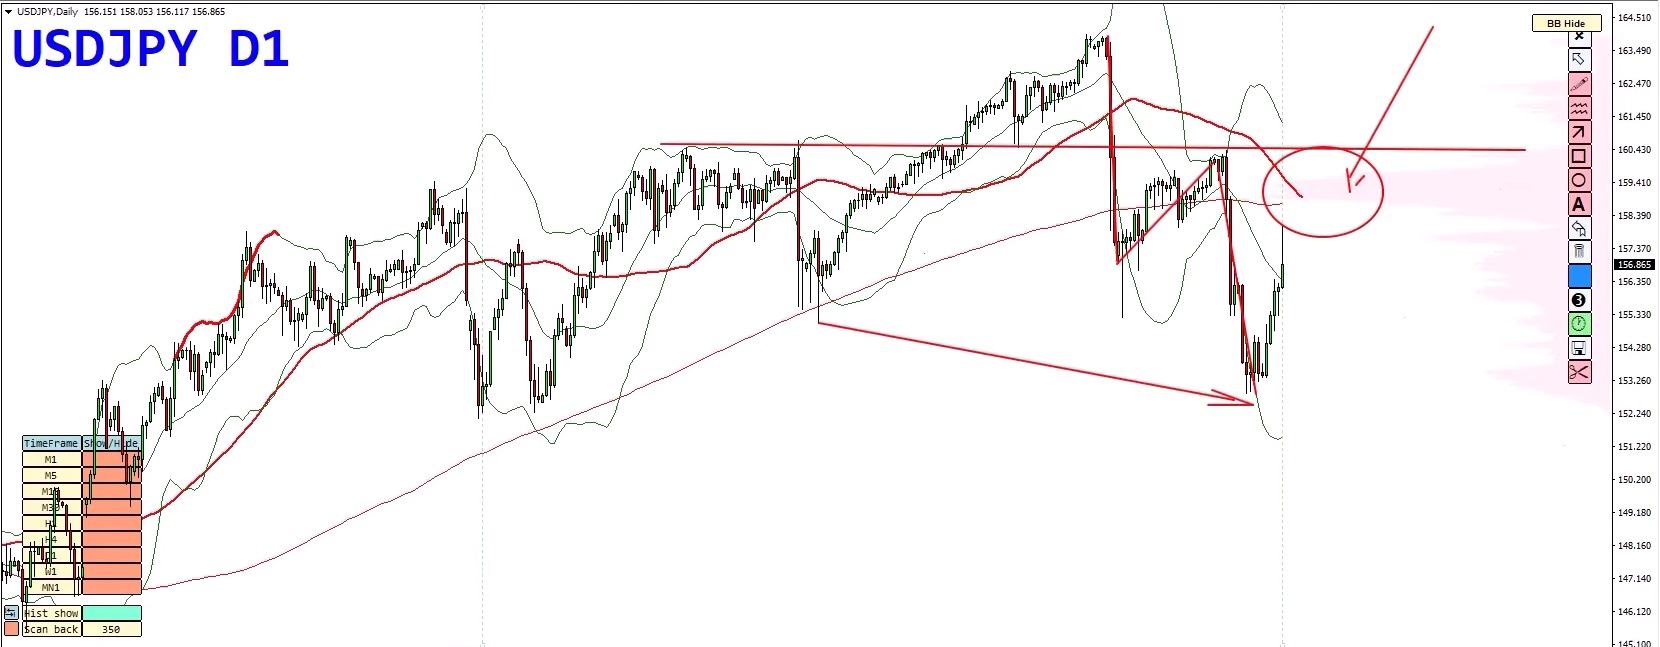
This zone is important because it combines several technical factors:
- The 250-period moving average.
- A significant higher-timeframe volume profile.
- A major supply area.
- Previous price structure that could now act as resistance.
If USD/JPY rallies into this region and bearish confirmation develops, I will be watching for potential selling opportunities.
Two USD/JPY Trading Scenarios
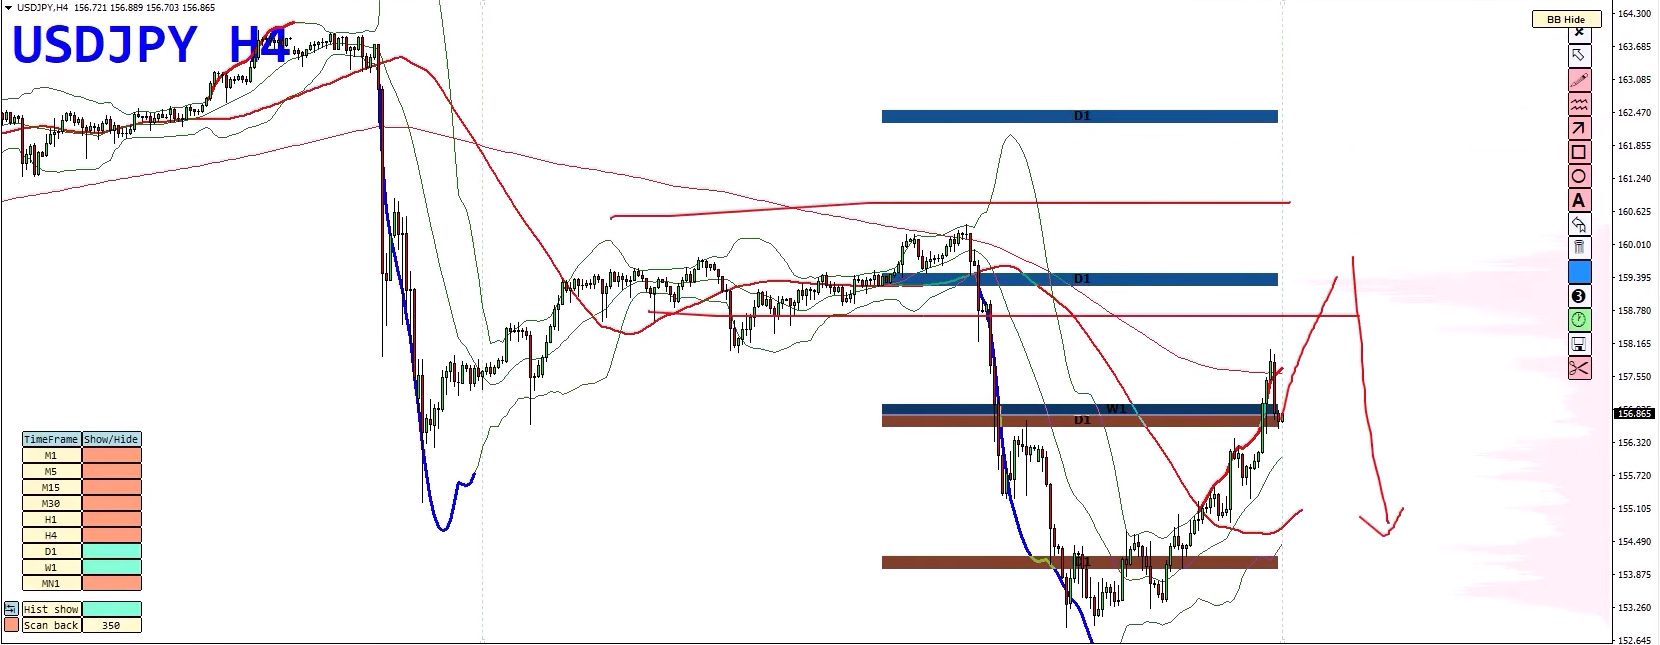
Scenario 1: Price Rallies Toward Resistance
If the market begins the week with a bullish move, I will be watching how price reacts around the key resistance zone.
A bearish divergence or another clear bearish price-action signal could provide a potential opportunity to sell.
Scenario 2: Price Continues Lower First
If USD/JPY continues to decline, I will be watching the rising support line and the strong demand area on the lower timeframes.
A temporary bounce from these zones could potentially lead to another upward move toward resistance.
If that happens, I would again look for bearish confirmation before considering a short position.
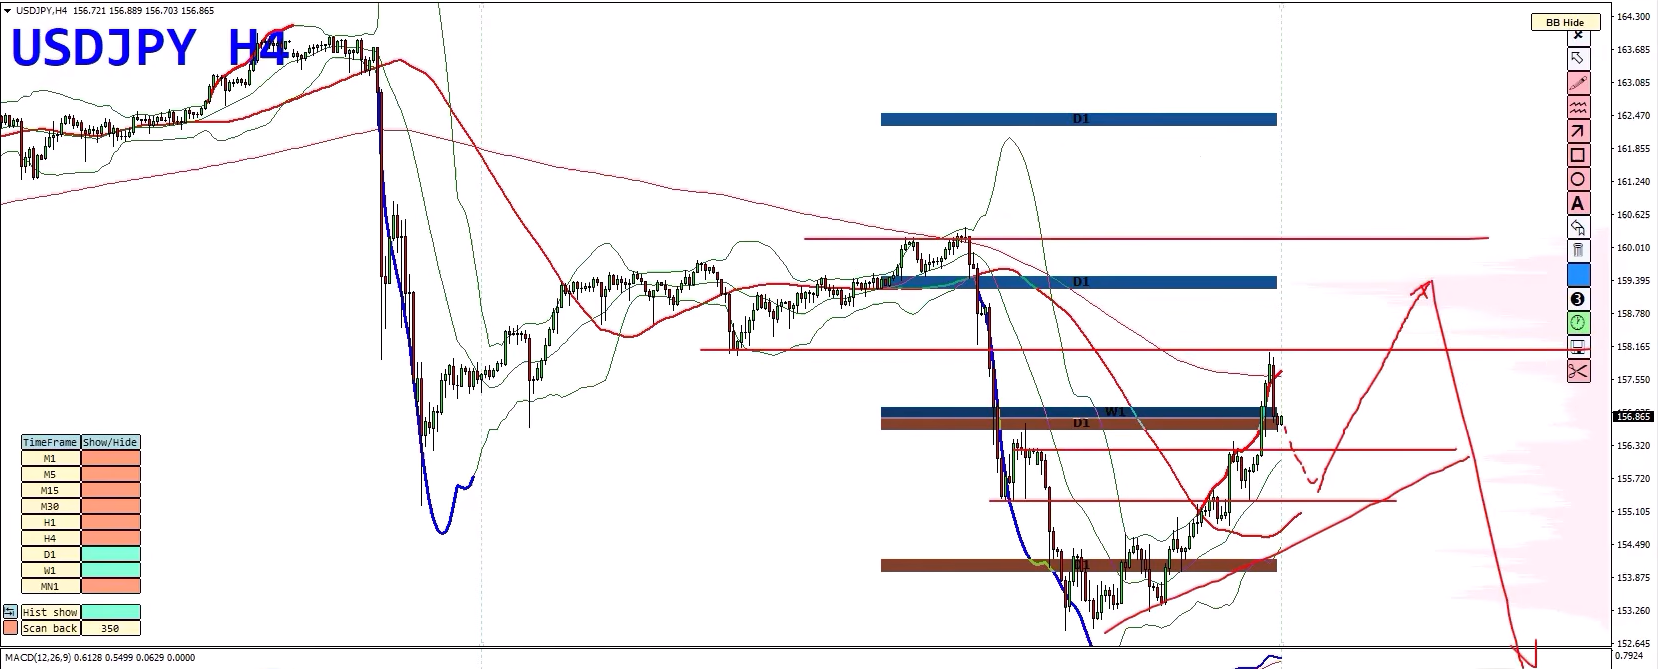
The key is to avoid selling blindly into support and instead wait for price to reach a meaningful technical area.
NZD/USD Forecast: A Potential Buy-the-Dip Opportunity
NZD/USD Trading Bias: Short-Term Bullish – Watching for a Potential Recovery
Now let’s take a look at a currency pair that offers a different technical picture.
NZD/USD is showing a potential short-term buying opportunity, despite the broader pressure affecting the market.
The daily chart reveals a rising support line, while previous lows are acting as a demand area.
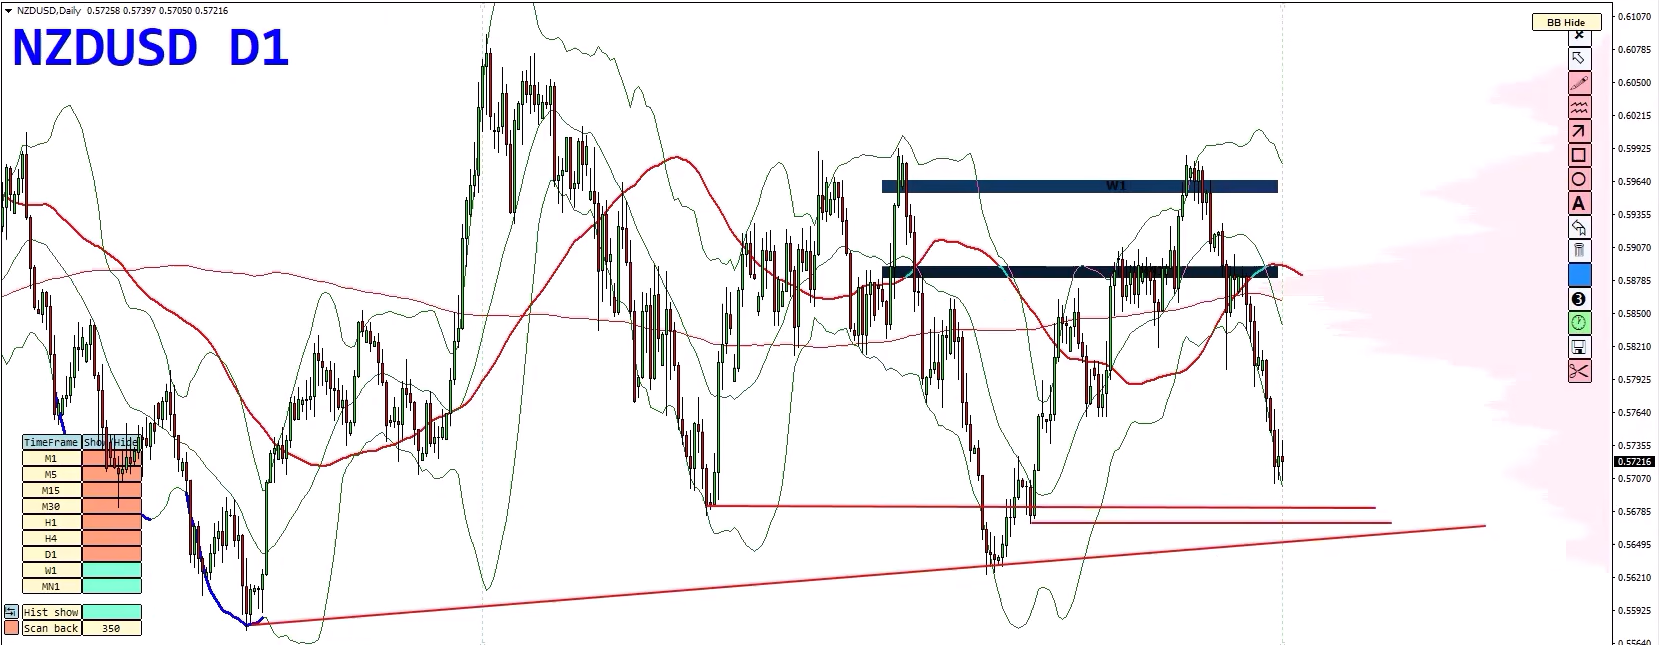
This support zone is particularly interesting because it also coincides with the dynamic support provided by the Bollinger Bands.
Why Am I Watching NZD/USD?
There are several technical factors coming together:
- A rising support line.
- A demand zone formed around previous lows.
- A dynamic support area based on the Bollinger Bands.
- RSI approaching oversold territory.
- A potential bullish divergence on the four-hour chart.
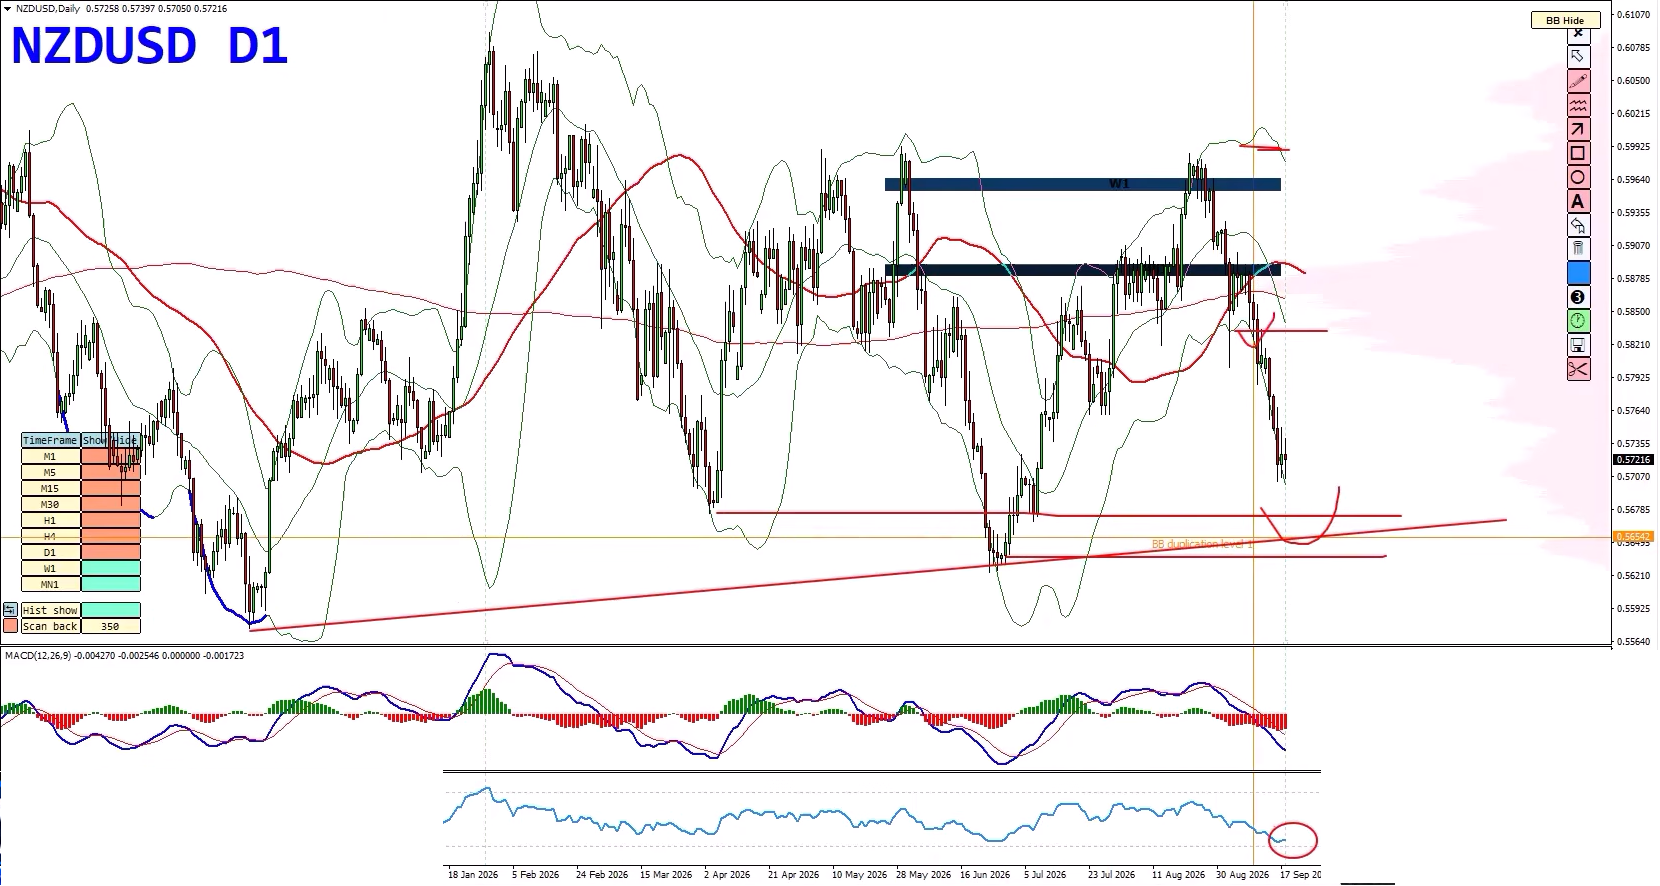
When several technical factors align around the same price area, it can create an interesting zone to monitor for a potential trading opportunity.
Four-Hour Chart: Bullish Divergence
On the four-hour chart, price has been riding along the lower Bollinger Band for an extended period.
At the same time, we are watching for a potential bullish divergence.
This means price is forming lower lows, while the indicator is forming higher lows.
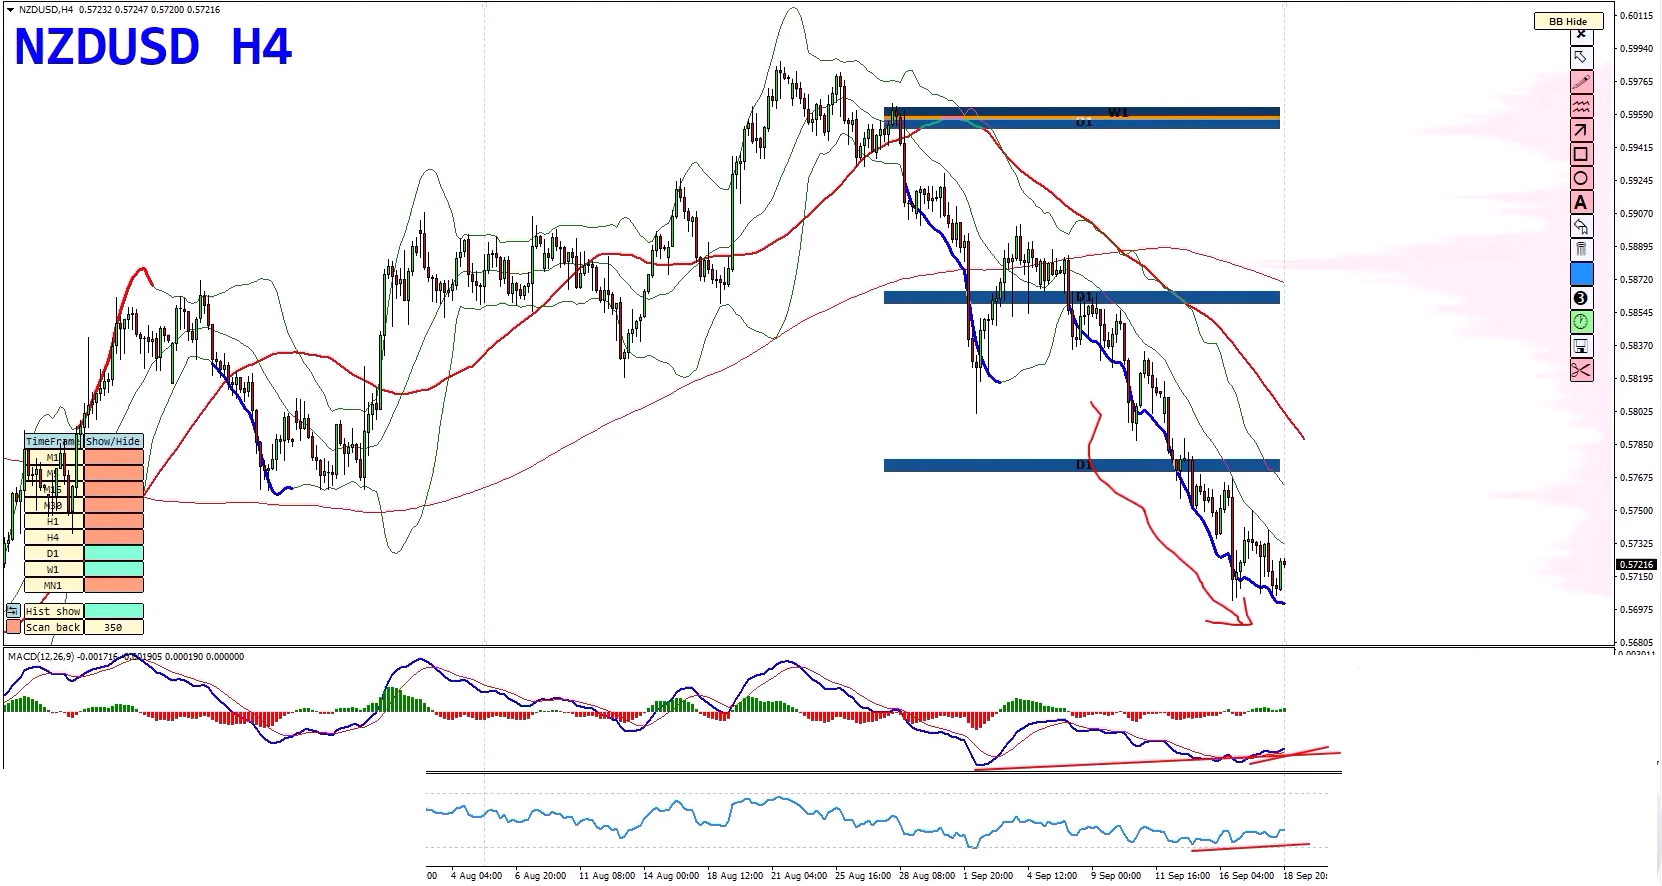
If confirmed, this could suggest that the selling momentum is slowing down and a short-term recovery may develop.
However, divergence alone is not a buy signal. I would still want to see price action confirm the reversal.
NZD/USD Trading Plan
My preferred approach is to look for potential buying opportunities around the daily and weekly support zones.
If price reacts positively from the demand area and bullish confirmation develops, a recovery toward the next resistance levels could become possible.
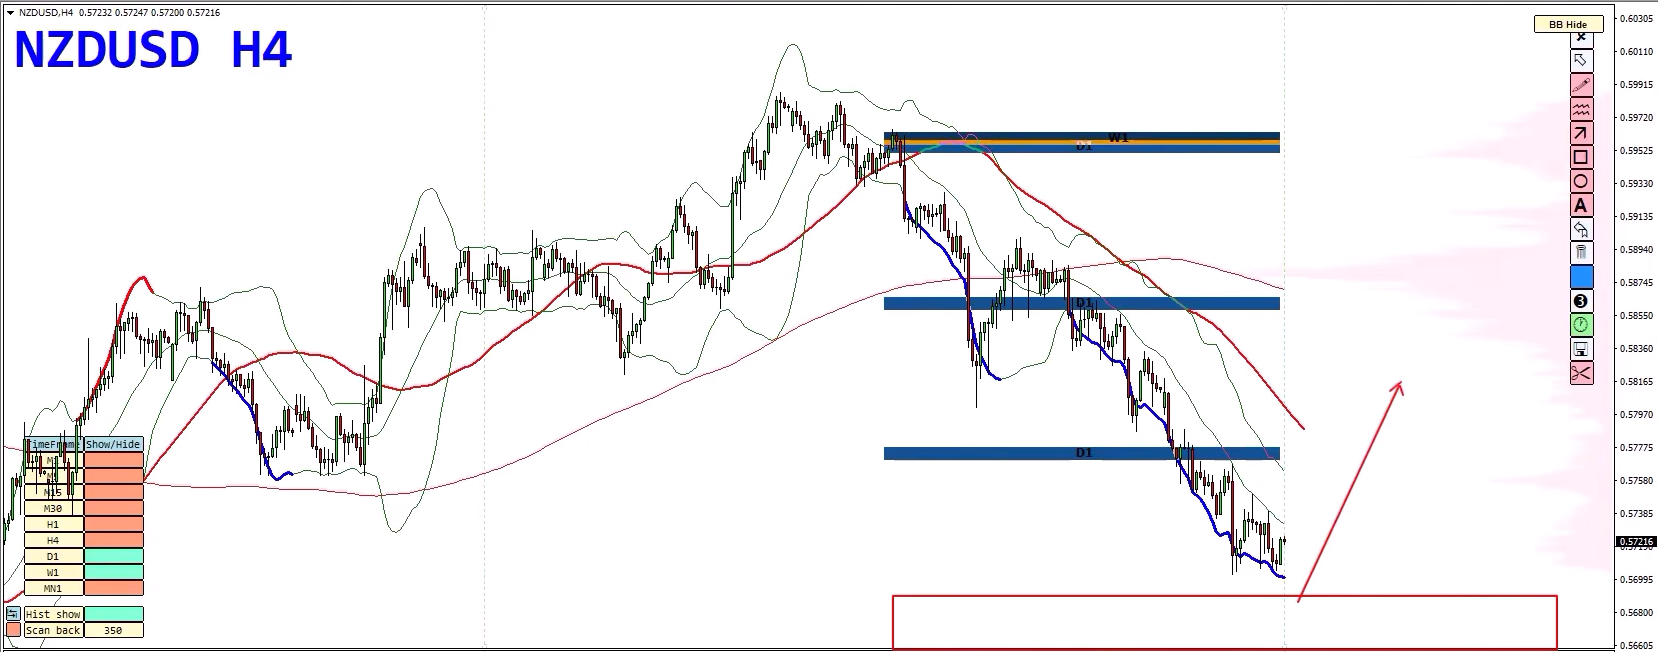
The objective here is not to predict the exact bottom, but to identify a technically meaningful area where the risk can be structured around a clear invalidation level.
Gold Forecast: Could Gold Recover Toward 5,000 Before Another Decline?
Gold Trading Bias: Bearish in the Longer Term – Watching for a Potential Short-Term Recovery
Gold is one of the most interesting markets in this week’s forecast.
Despite the recent selling pressure, I believe the longer-term bearish move may not be finished.
However, that does not necessarily mean gold must continue falling immediately.
The short-term structure could still allow for a recovery before another bearish move develops.
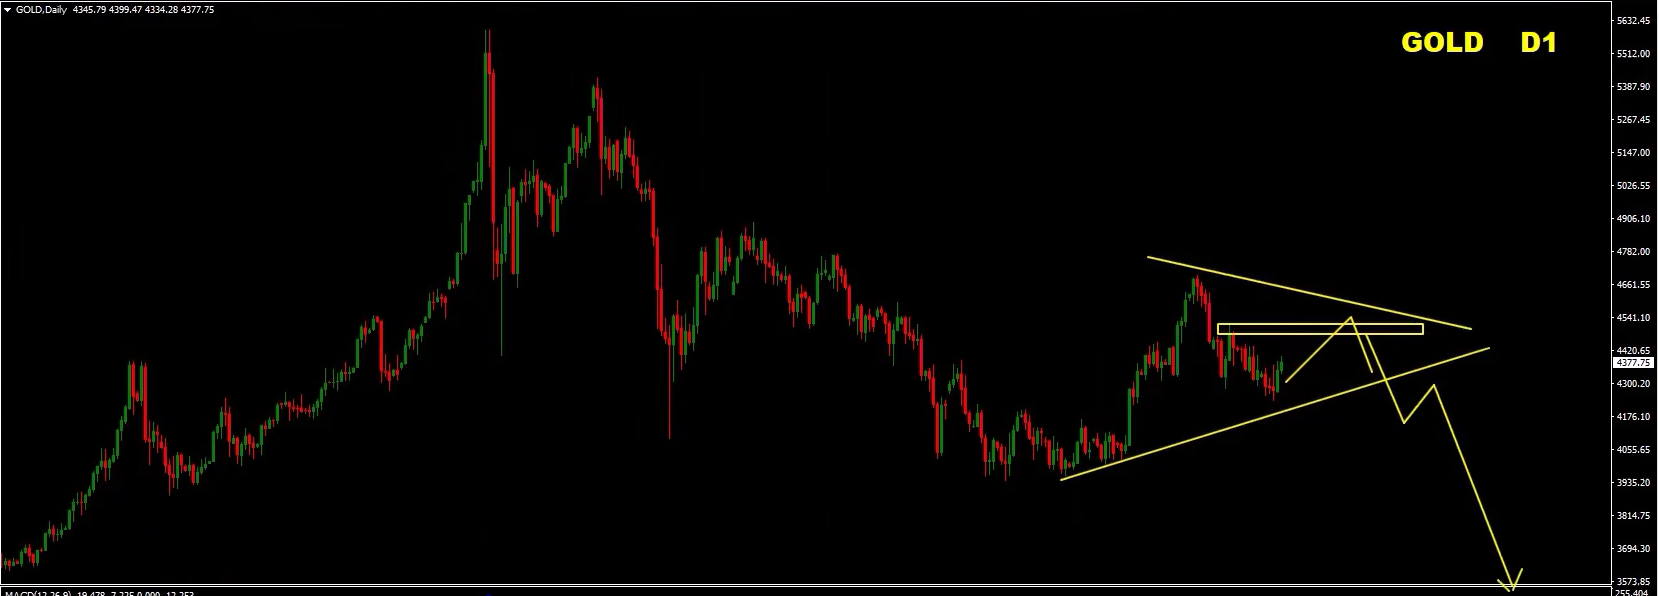
Scenario 1: A Recovery Toward 4,800–5,000
One possible scenario is that gold completes an ABCD-style corrective structure.
If this develops, price could potentially recover toward 4,800 and possibly the 5,000 area.
If gold reaches these levels and a bearish divergence or another clear reversal signal develops, I will be watching for a potential selling opportunity.
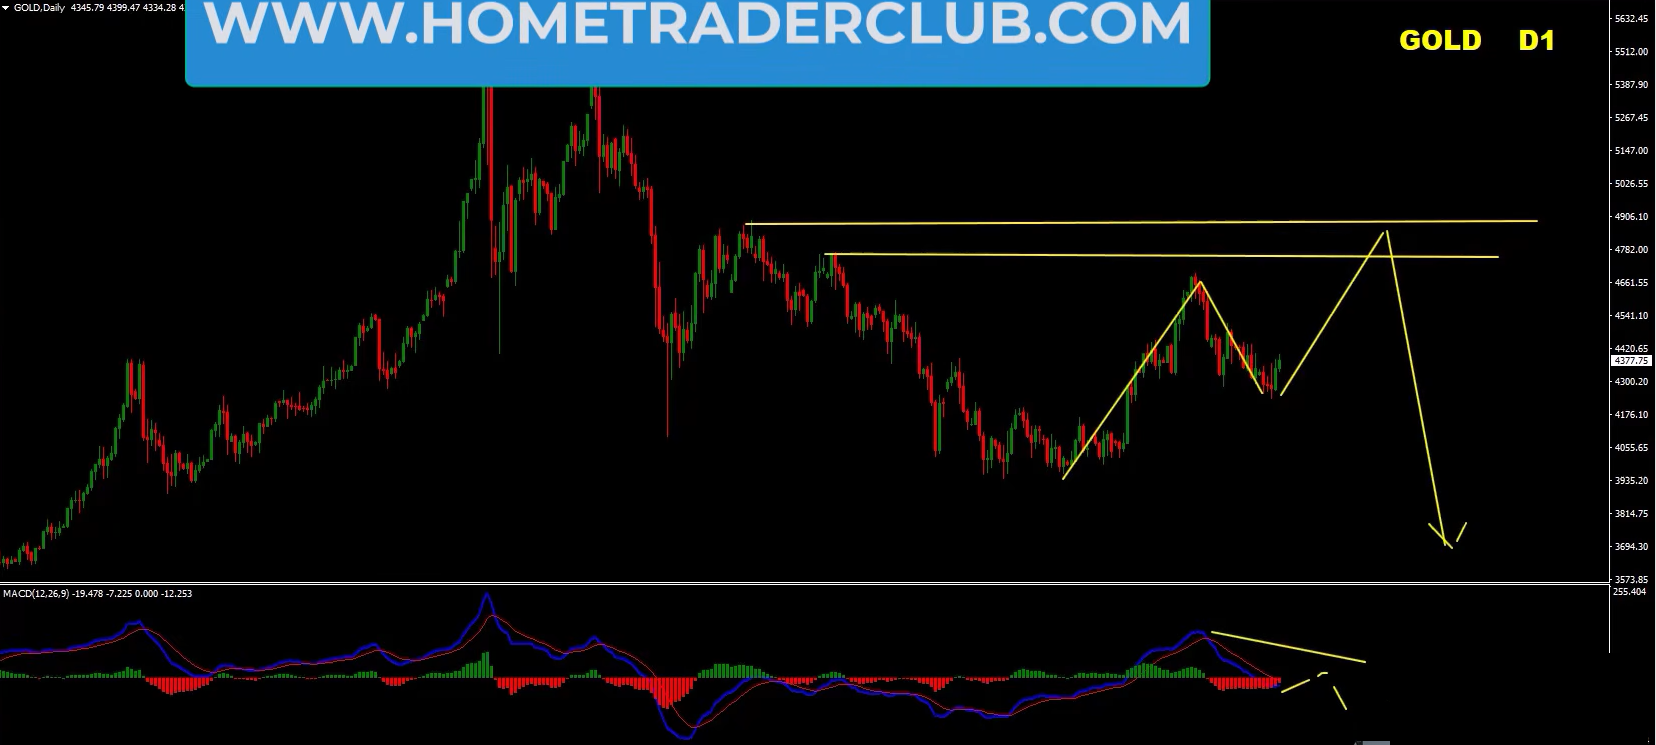
The key is to let the market complete the recovery and then look for confirmation.
Scenario 2: A Weaker Recovery Toward 4,500
The second possibility is that gold fails to develop a strong recovery.
Instead, price could form a range and produce a relatively weak upward move toward the 4,500 area.
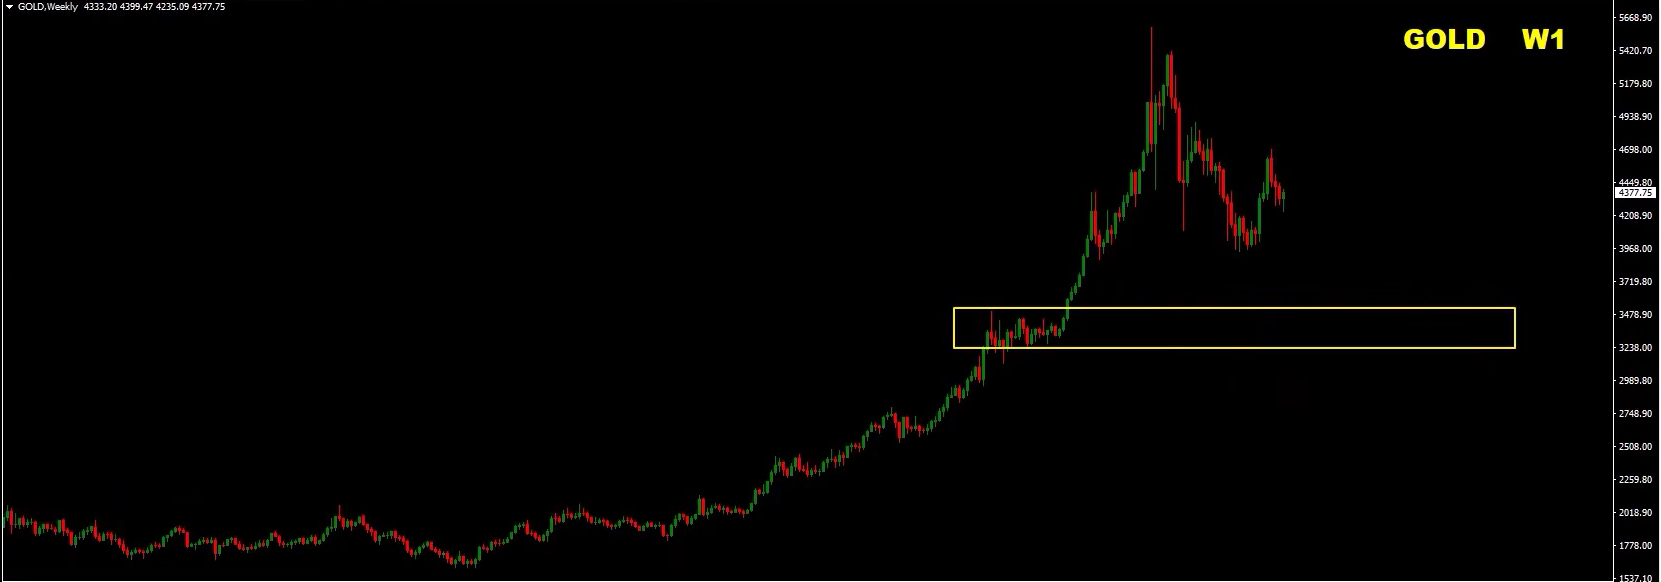
If lower highs continue to develop and the range eventually breaks to the downside, the bearish structure could extend further.
In that case, the 3,500 region becomes an important longer-term downside reference, corresponding to the major weekly range discussed in the analysis.
Gold Trading Plan
My longer-term preference remains to sell rallies rather than chase the market lower.
The areas I am watching are:
| Gold Price Area | Potential Technical Role |
|---|---|
| 4,500 | Possible recovery / resistance area |
| 4,800–5,000 | Potential corrective recovery zone |
| 3,500 | Longer-term downside reference |
These are scenario-based technical levels, not guaranteed targets.
I would want to see how price behaves around these zones before making any trading decision.
Final Thoughts: What Is the Most Interesting Trading Opportunity This Week?
This week’s Forex and commodities outlook offers several interesting possibilities.
EUR/USD and USD/JPY remain on my radar for potential selling opportunities, particularly if price rallies toward important resistance zones.
NZD/USD is showing a different picture, with the possibility of a short-term recovery from support if bullish confirmation develops.
Gold remains a market I am watching closely, especially for a potential corrective rally before another bearish move.
As always, the objective is to identify high-quality trading opportunities while keeping risk under control.
What do you think about the markets this week?
Do you see EUR/USD moving toward 1.08? Could USD/JPY be preparing for a deeper correction? Or is gold about to recover toward 5,000 before the next decline?
Let us know your thoughts and the trading opportunities you are watching in the comments below.
If you are new to our channel, subscribe for more Forex market analysis, trading opportunities, and educational content.
And if you want to join our trading family, I invite you to visit Home Trader Club and explore the trading tools, strategies, and education available to our community.
 Join the Home Trader Club
Want to access the tools, systems, and real-time education we use daily?
With AvaTrade Broker’s support, you can now enjoy up to one full year of access to the Home Trader Club — including:
-
All professional trading systems
-
Access to our new project, the Home Trader Club trade copier, where our traders trade and you can copy.
-
Real-time trade ideas and setups
-
Full access to our course library and trading marketplace
 Join here: https://tracking.avapartner.com/dR0AAA
Wishing you a profitable week ahead!
Vladimir Ribakov
Internationally Certified Financial Technician
Home Trader Club
Risk Disclaimer
Trading Forex, CFDs, commodities, and other financial instruments involves significant risk and may not be suitable for every investor. Leverage can magnify both profits and losses. The market analysis and trading scenarios presented in this article are for educational and informational purposes only and do not constitute investment advice or a recommendation to buy or sell any financial instrument.
Always conduct your own research, assess your financial situation, and use appropriate risk management before entering a trade.