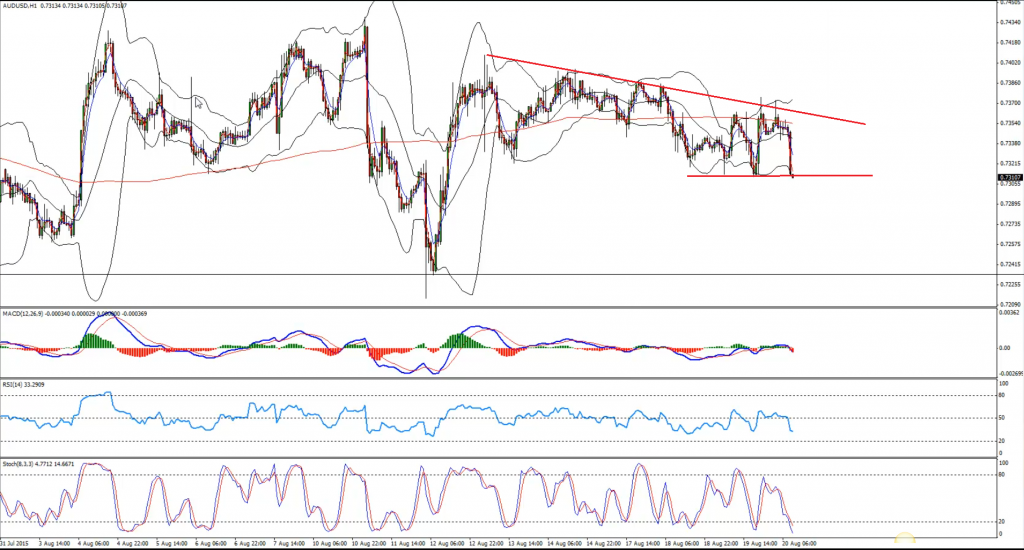
The Aussie Dollar traded close to a major breakout area recently against the US dollar, but failed to gain pace to trade higher. There is a bearish trend line formed on the hourly chart of the AUDUSD pair, which must be cleared for a buy trade. However, on the other hand, if the pair fails to break higher, and breaches an important support area around 0.7300, then more losses are possible.
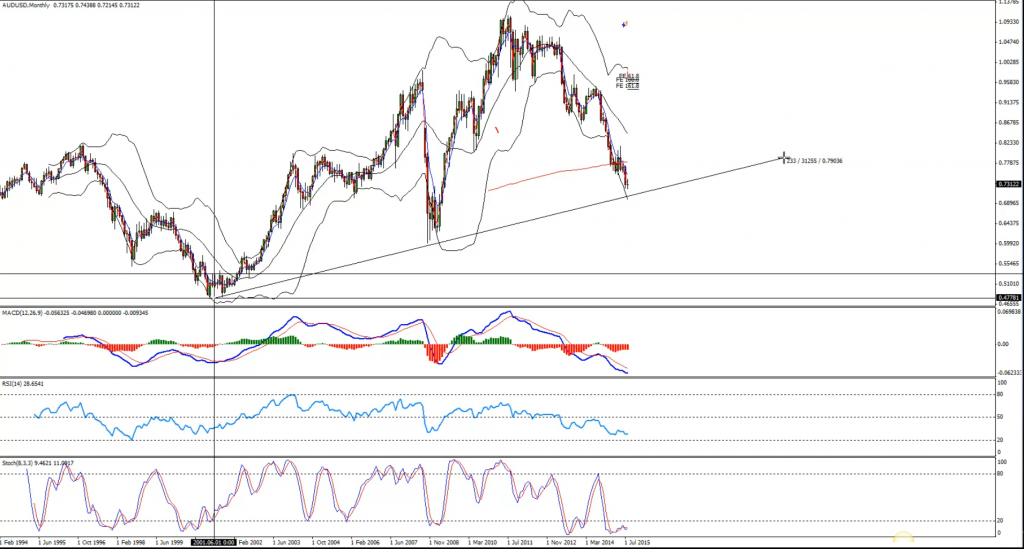
There is a monster support trend line on the monthly chart, which can be the final target of sellers if the AUDUSD pair moves lower.
Technical Analysis
Monthly– Chart representing the possibility of AUDUSD pair testing an important support trend line.
Entry:
H1– We can enter a buy trade in the AUDUSD pair if breaks and settles above the highlighted trend line, and stays above the 0.7300 support area. A break and close below 0.7300 would be a bearish call.
Target 1: 0.7420
Target 2: 0.7500
Stop Loss: Below the 0.7300 support area
Video Explanation:


