
Watch the webinar of How To Trade Range Breakout With Price Action (NO INDICATORS)
Hi Traders! In this article, I would like to show you how to apply the very simple basic principle of price action in a range breakout strategy. In order to explain this strategy, I will take an example that we discussed and traded in my trading club on GBPCHF.
On the table below you can see my trading watch list. This list is all the trading opportunities I share with my followers on daily basis, in Traders Academy Club (you can join us here).
Step 1 – Market Analysis (Multi Time Frames)
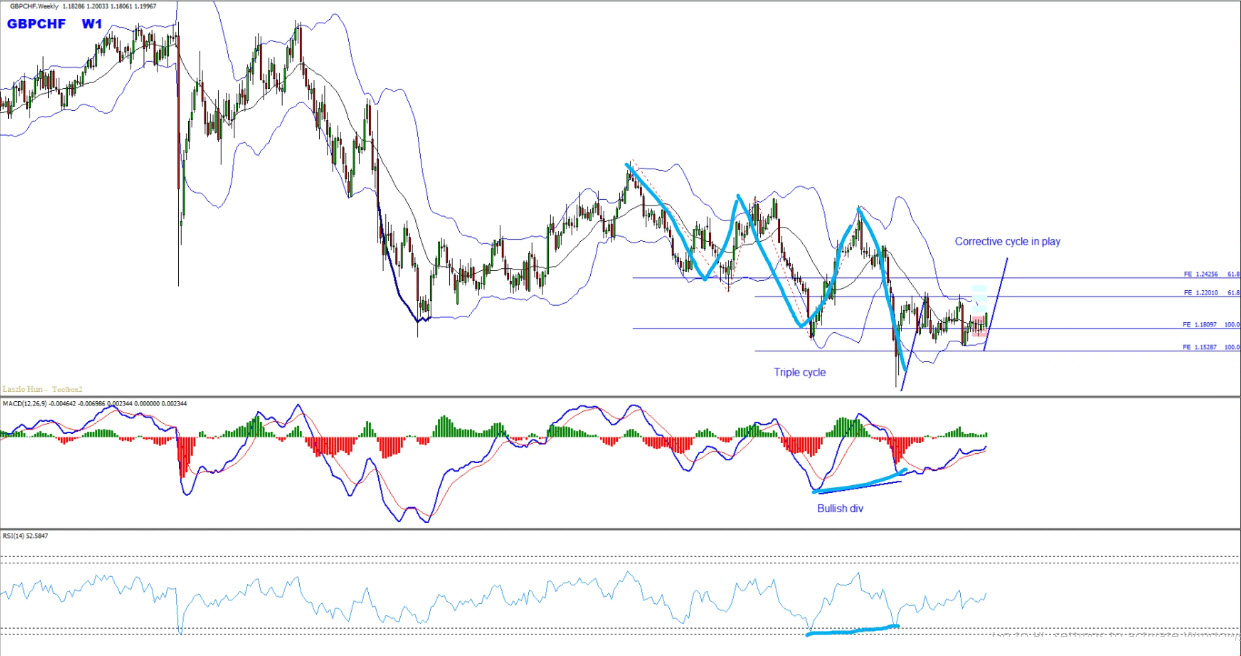
Starting with the multi-timeframe analysis we want to identify the higher time frames trend and directions. In this specific example, On the weekly chart, we had a triple wave down which ended with a bullish divergence on the MACD and RSI indicator.
Note: If you want to learn more in-depth insights about divergences, you can benefit greatly from the videos on my channel here while also embarking upon Divergence University for comprehensive divergence education.
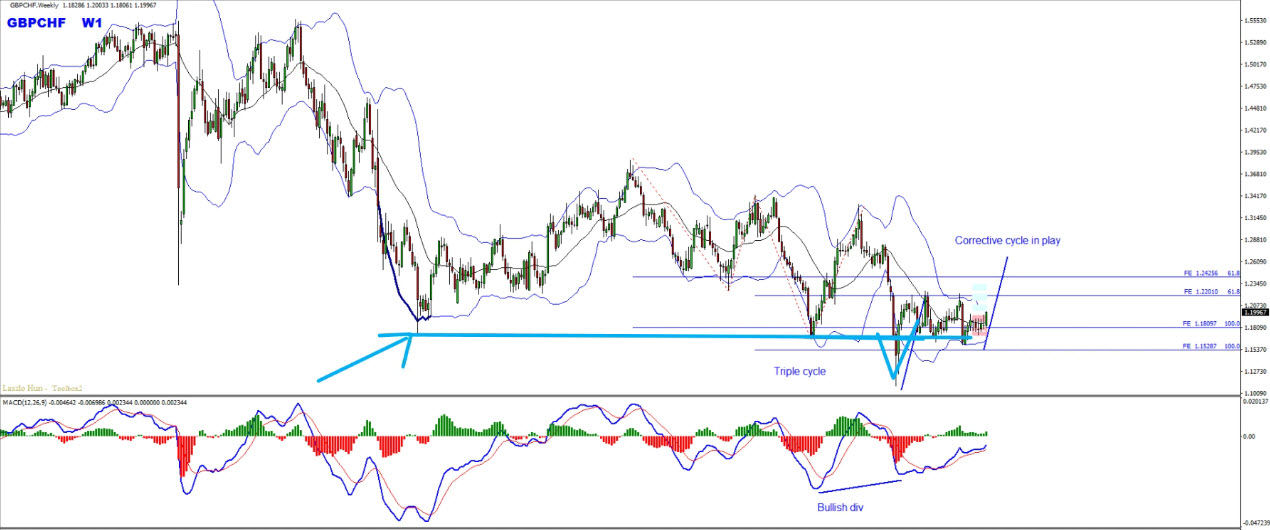
 In addition to this, the price has also created multiple false breaks as you can see in the screenshot below.
This is on the view of the weekly chart so there is a good chance that the market is trying to build up a corrective cycle. As this is the weekly timeframe such correction could be a long journey and could take a while to complete. On the whole, the big picture here is bullish.
Step 2 – Price Action To Verify The Expected Direction
Now we go to one timeframe lower (D1 chart), on the daily chart we could see that the price has created the first push to the upside in two clear waves. Then we got a false break of the previous high and low as you can see in the screenshot below. The price then retested the same high, and then we had another false breakout of the same low. Basically, the price has created a bigger range/consolidation moves here and is moving inside it.
Alternatively, you can also mark this range as a big expanded one as shown in the screenshot below. The bottom line here is that the price is moving inside a consolidation.
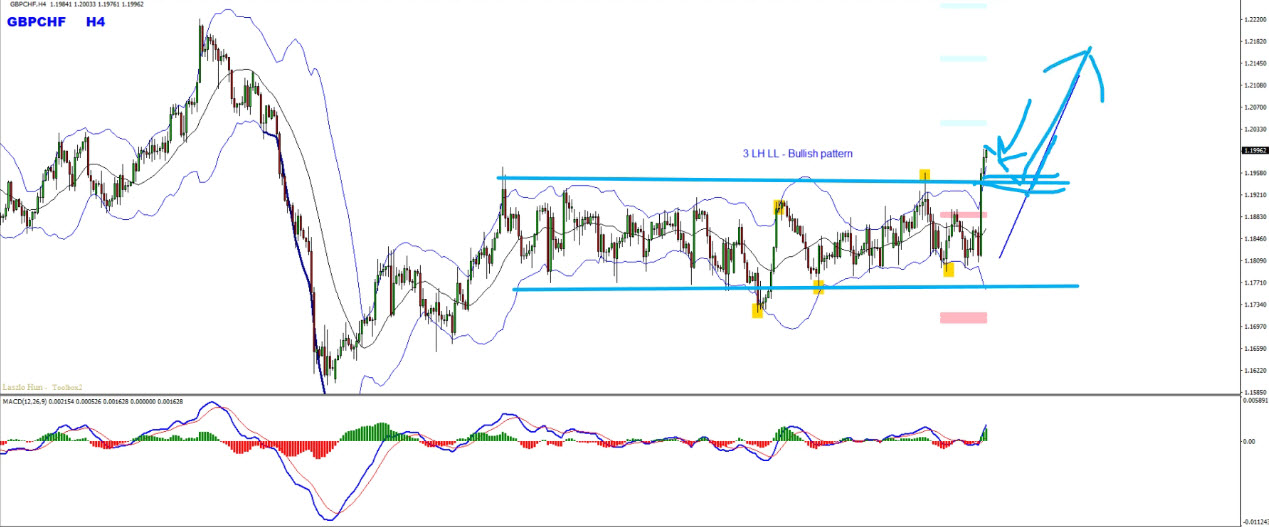
We can then see that the price is rallying upside again from the bottom of this range in two first pushes followed by a small pullback, and then it was moving inside a clear consolidation. At the moment when the price broke above the top of this range, we find ourselves in a situation where we wanted to make a decision whether this will be a logical breakout, or it will be a fake breakout.
Of course, in advance, we never know how the market will choose to behave, but I want to show you the technique which I teach in my trading club to spot the opportunities, which is also very relevant for the range breakouts.
Step 3 – Trading
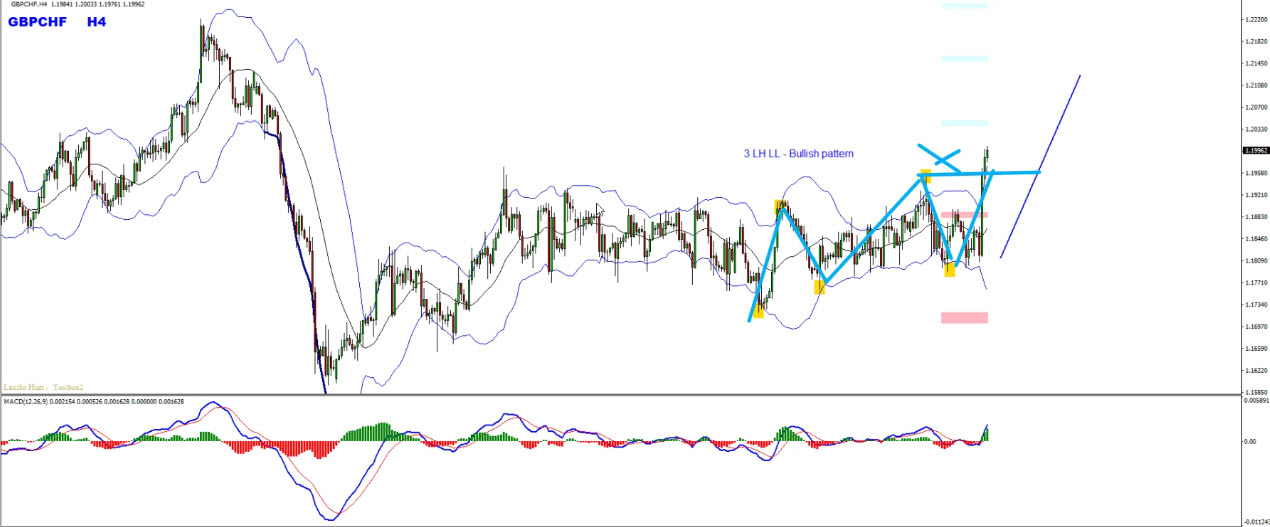
This is the moment where the third lower timeframe (H4 chart in my multi-time frame analysis) verified the break of the third high as you can in the screenshot below. So what happens here is that the price has recreated the three higher highs, higher lows pattern (Generally three higher highs, higher lows pattern happens in bullish market momentum, this is how the bulls show us their control). Adding this to the fact that this extra confirmation of three higher highs, higher lows came at a perfect time when everything was synchronized on the higher time frames.
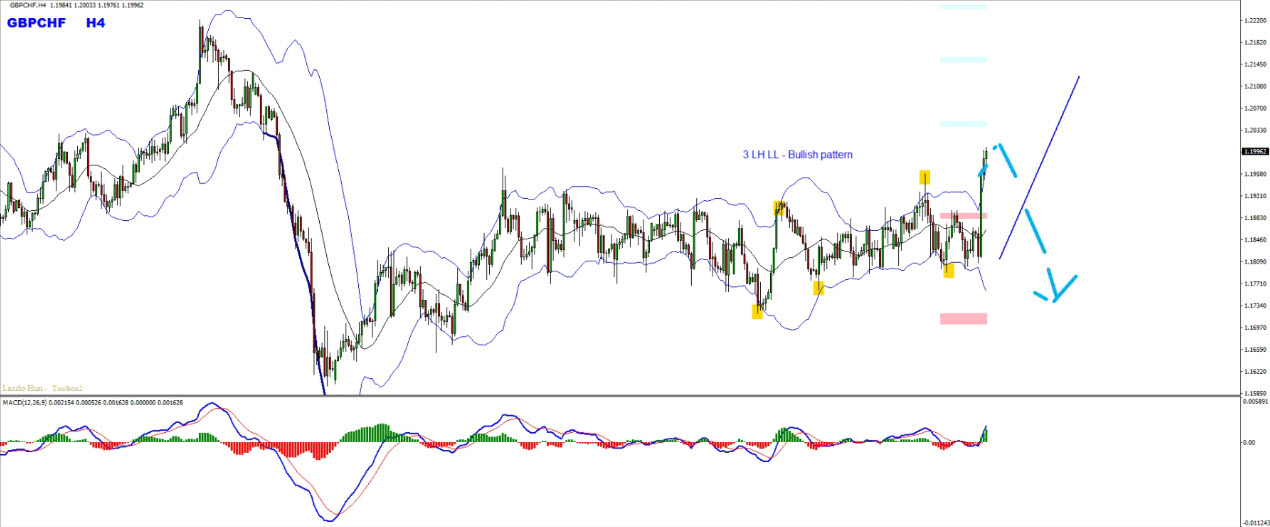
Keep in mind that at this very moment we don’t know whether the price will retest the breakout and move higher.
Or alternatively, this might turn to be a false breakout and the price might move lower again.
We can’t predict this but when we start a position this technique provides us a very clear picture in our favor as everything is synchronized in the same direction on multi-timeframes like the example shown above. When this happens then that’s the sign where I know that my probabilities are indeed higher. We may then look for the target zone looking for the next key resistance levels (as this is a bullish setup we look for the next key resistance levels, if it is a bearish setup then we need to look for the support levels) or you can choose the target based on the strategies or indicators that you work with, it all fits here but all this starts with analyzing the situation on the price action first of all.
How Do I Invalidate Such A Situation?
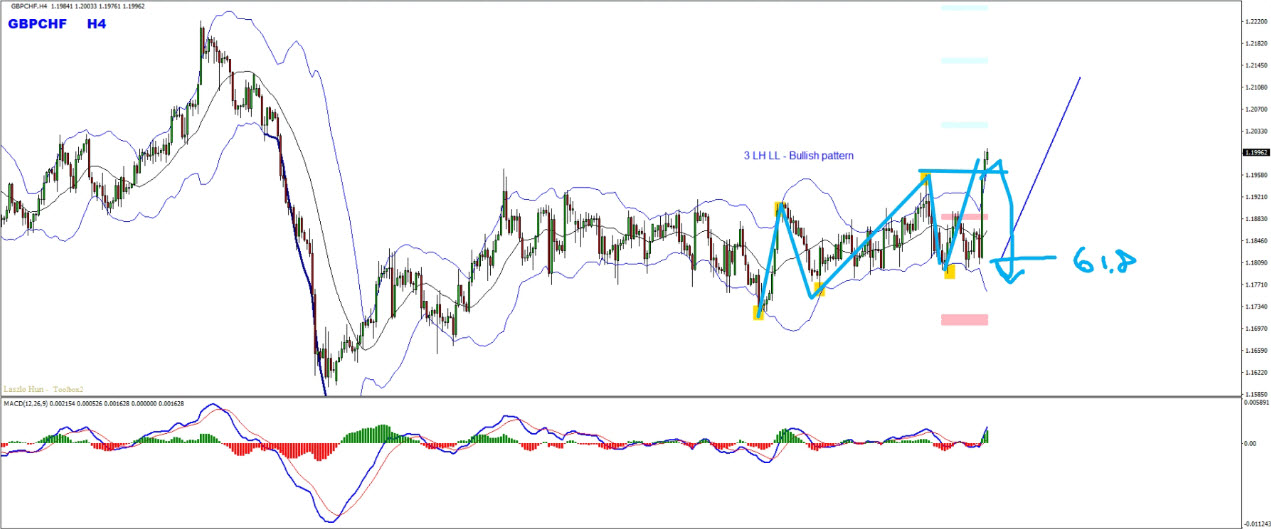
Identifying direction on multiple time frames, finding the optimal entry are all crucial to your long term success. However, managing your position and limiting the loss could be extremely beneficial. You probably heard the saying: “Let your profits run, and cut your losses small”. Once I see the trending pattern I have a very specific method of invalidating or cutting the trade if it doesn’t go in the direction I’m expecting it to go. How do I do that? Simple – using Fibonacci retracement.
We have an ongoing bullish trend with the price creating three higher highs, higher lows what I don’t want to see here is the price going through all the Fibonacci retracement levels in one straight move. So if the price moves lower, breaks, and holds below the 61.8% Fibonacci retracement zone of this bullish trend pattern then this bullish view will be invalidated.
Conclusion
So, traders, this is how you apply the basic principle of price action in a range breakout strategy. We don’t know how the market will move and this strategy is not some sort of holy grail solution that will always work in your favor. But in a fully synchronized analysis, this entry technique gives you a high probability to end up as a winner or at least not with a loss, if you have to intervene and manage your position. This is a very crucial thing because in the business of trading what we are dealing with is statistics (in other words probabilities) and what we need here are higher probabilities to start the trade. When applying this strategy in action I know that the probability of winning this trade is indeed higher.
Note: If you want to learn about Money Management you can find it here
Once again I invite you to join me in my club and enjoy from our Live Market Analysis and our trading reports on a daily basis and improve your trading with us.
Also, you can get one of my strategies free of charge. You will find all the details here
Thank you for your time in reading this article.
Yours to success,
Vladimir Ribakov
Certified Financial Technician







I appreciate you