Hi Traders! Weekly Forex Forecast 9th October 2022 is here. In this post, I analyze and forecast EURUSD and AUDCAD. EURUSD has been moving in a clean downtrend for a long time and is respecting a daily bearish channel. As long as the price structure remains inside the channel, I would look to sell the EURUSD pair. AUDCAD price action also suggests a clear bearish trend, and the price is moving inside a double bearish channel on the 4H time frame. I believe that selling the rallies is still the correct plan here.
You can watch the video explanation of this forecast here:
EURUSD
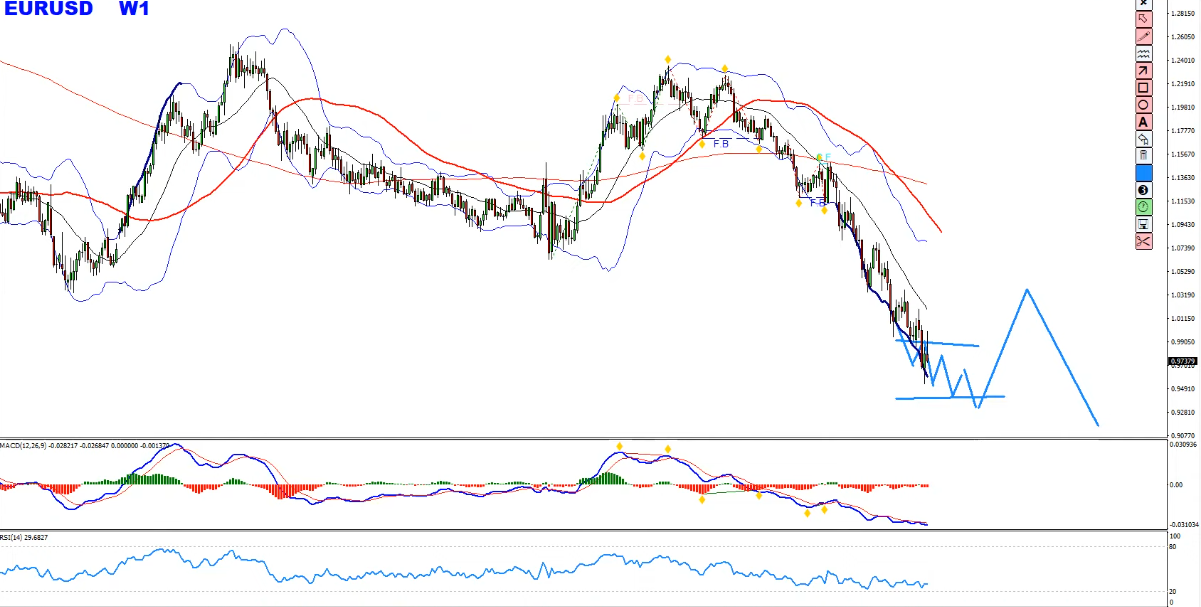
W1 – On the weekly chart, we have a massive bearish trend and so far it looks like this bearish trend is not over yet. However, I do believe that the price is slowly building up the bottom which very likely might create a more significant turn around which later on might continue lower further.
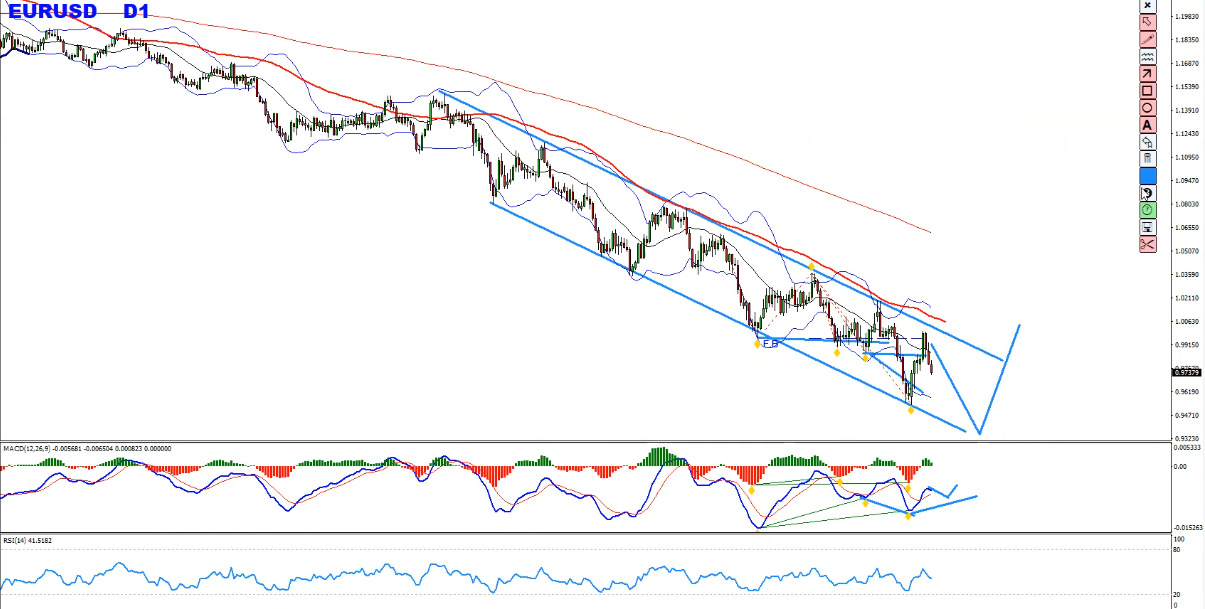
D1 – On the daily chart, the price is moving inside a bearish channel and it looks like the market is in the momentum of trying to achieve one final low and to complete the bullish divergence. Right now, after making the false breakout shown in the image below there is no bullish divergence in play yet, in such cases, most of the times, there is a good chance that the market might create one more fake low.
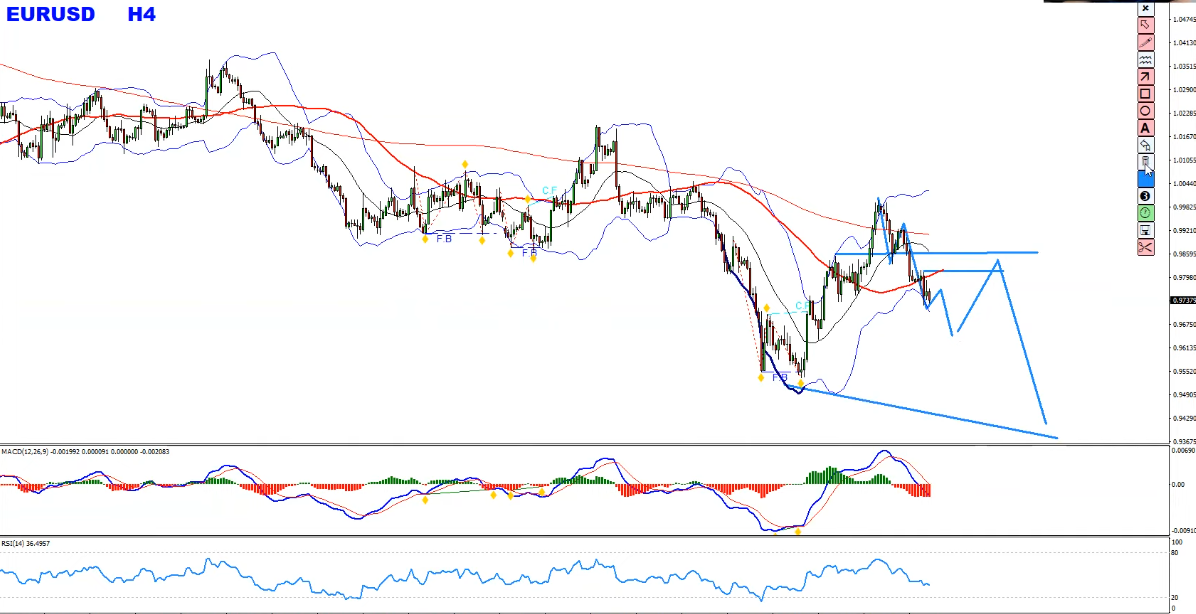
H4 – In my point of view, there are two possible scenarios here. The first scenario is, if this pair completes the structure of three lower highs, lower lows which represents the control of sellers. I may then expect a pullback towards the resistance zone shown in the image below and then I would be looking to sell the rallies until the daily chart creates a new low.
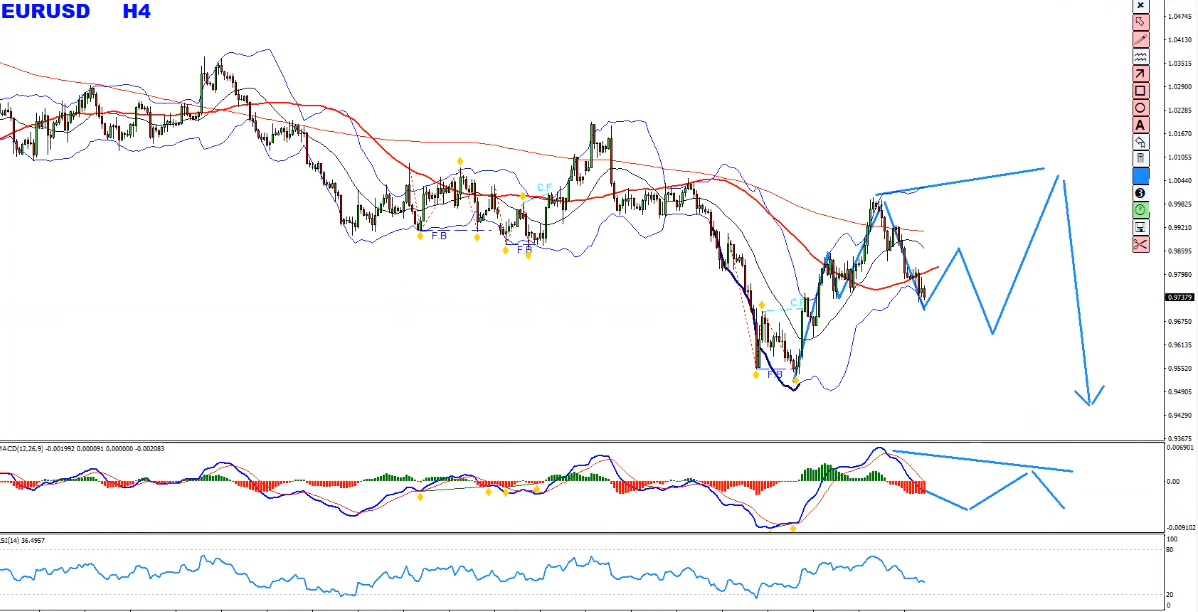
The alternative scenario here would be, the price might complete here some sort of a zigzag structure and it will try to make one more fake high, while the MACD indicator will create a bearish divergence and then I would be looking for sells.
AUDCAD
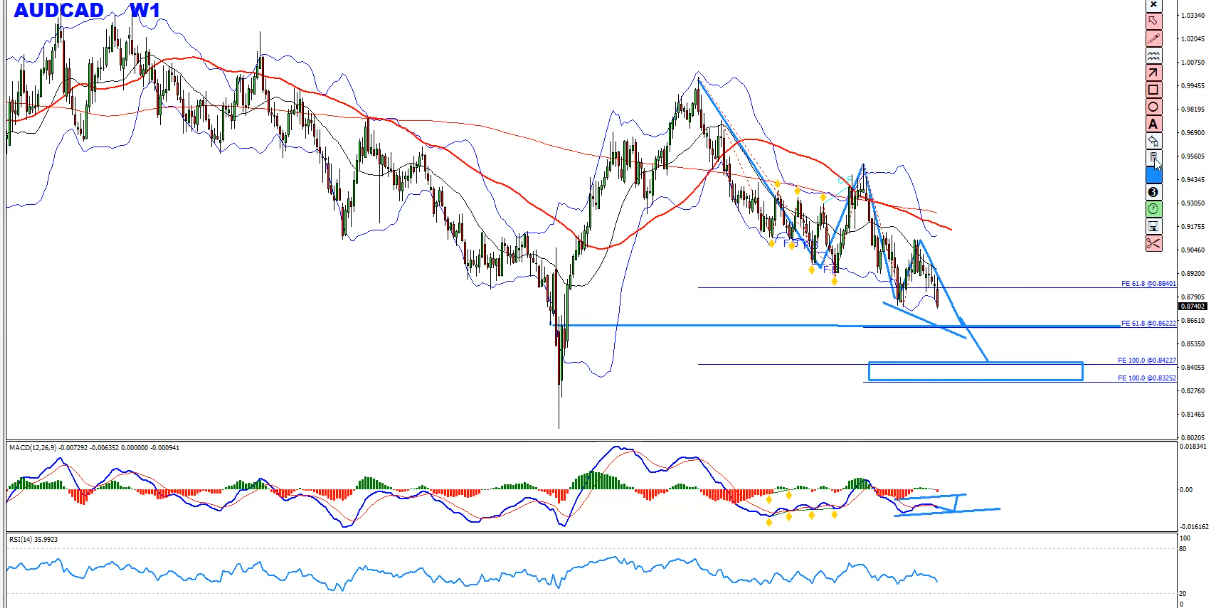
W1 – On the weekly chart, we have an ongoing bearish trend and if I plot the Fibonacci expansion on the on going legs, we have two key support zones that has formed. The price is nearing the first key support zone, if it manages to go below this area then the next key support zone to look for is the 100% Fibonacci expansion levels of both measured legs. This bearish view will be relevant for me until the weekly chart didn’t complete a bullish divergence.
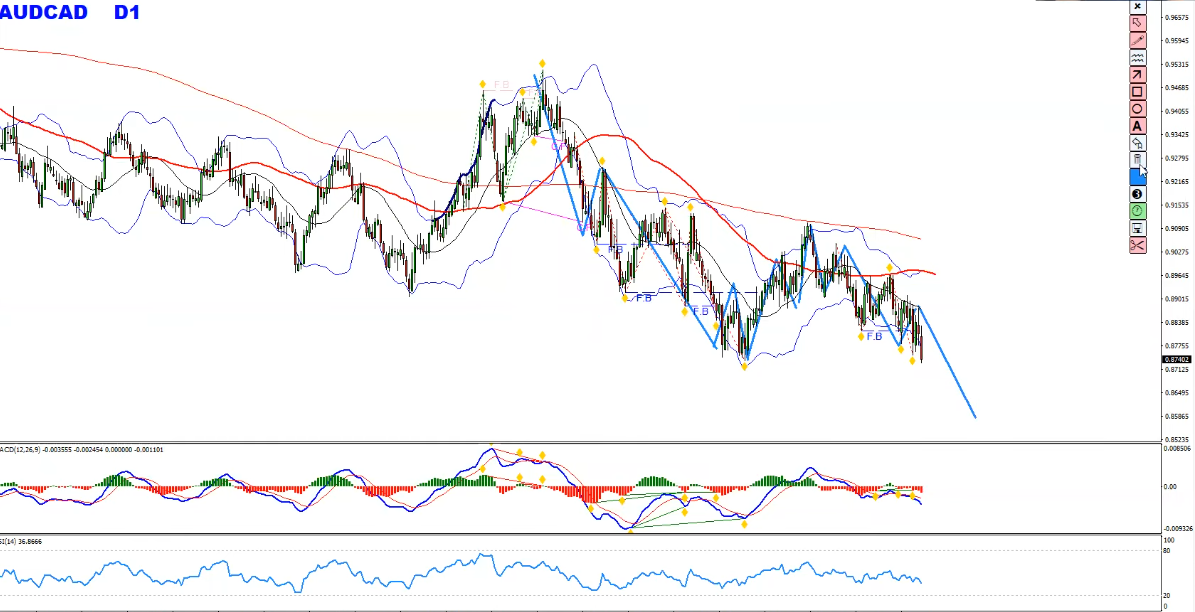
D1 – Looking at the daily chart, we could see that the price has created a bearish trend structure followed by an ABCD correction. Currently it looks like price is completing the final low.
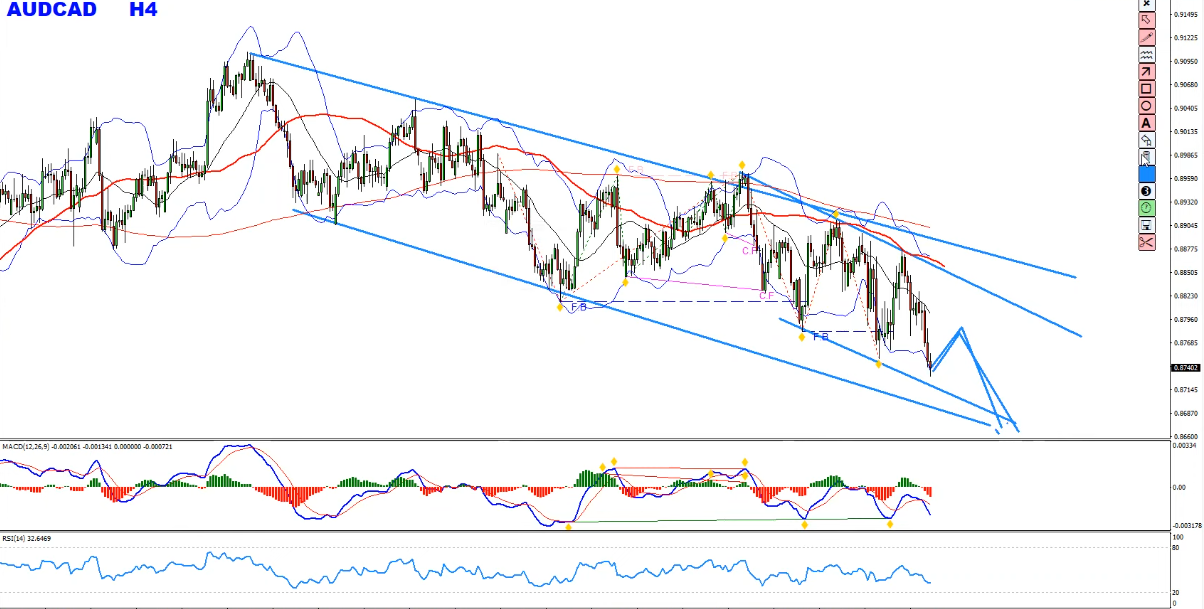
H4 – On the H4 chart, the price is moving inside a bearish channel and I believe in the short term we should be looking for further continuation lower until this pair completes the multi-timeframe bullish divergence. So, I would be looking to trade the inner channel shown in the image below and my plan here is to sell the rallies.
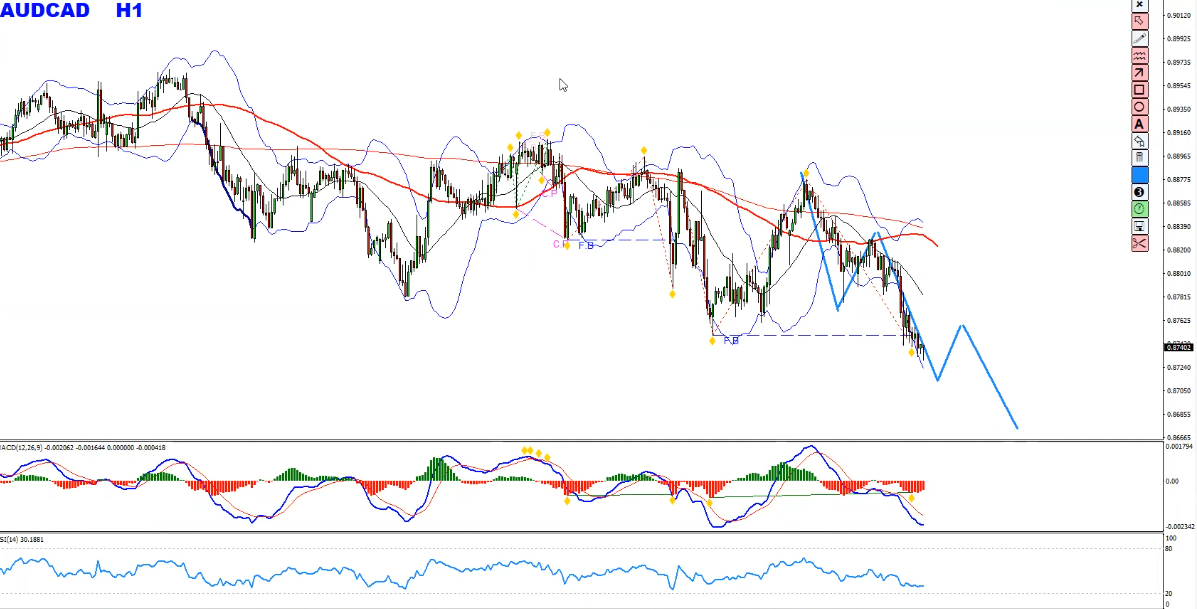
H1 – On the H1 chart, I expect the price to create something like what is shown in the image below to complete the final low with bullish divergences on the H4, daily and weekly charts. My bearish view remains relevant as long as the price stays inside the H4 bearish channel and as long as the structure of lower highs, lower lows remains, sell the rallies would be my plan here.
Download my best indicators here here
Join our trading family and enjoy all our REAL-TIME trading opportunities and REAL-TIME trading education!
You will also find a pretty extensive database of educational materials here in the blog – just use the search or check out the Forex Education section above.
If you have any further questions, don’t hesitate to drop a comment below!
Yours to your success,
Vladimir Ribakov
Certified Financial Technician


