


Hello traders and good week.
In this article, I analyze and forecast GBPUSD and OIL.
GBPUSD made an amazing bullish recovery right from the bottom of the worse crisis they experienced and the price hitting the 1.05 level. But this bullish run is heading to a strong rejection zone, and I believe sell opportunities are coming soon. OIL has cooled down since the crazy rally when the inflation started, and the current bearish run is still here and still happening. I believe the bearish move should enter two key Fibonacci expansion levels, around 80 or even as low as 75.
A detailed analysis of these instruments is as follows.
You can watch the video of this weekly forecast here:
GBPUSD
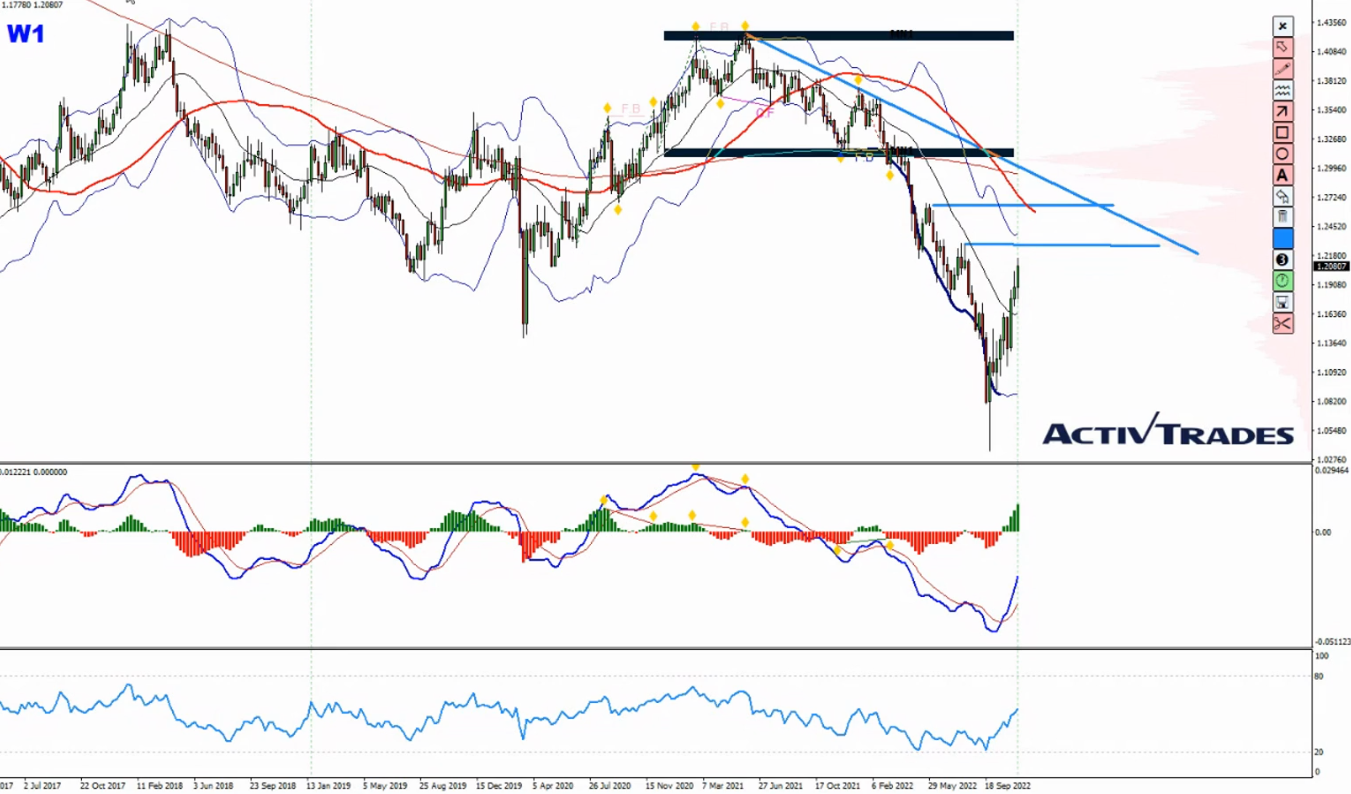
Weekly timeframe – On the weekly chart, we can see a clear bearish trendline that acts as a dynamic falling resistance and clear resistance zones on previous swing highs of the 1st of August 2022 and one 27th of May 2022. These levels are key resistance zones and might cause the price to block and move down.
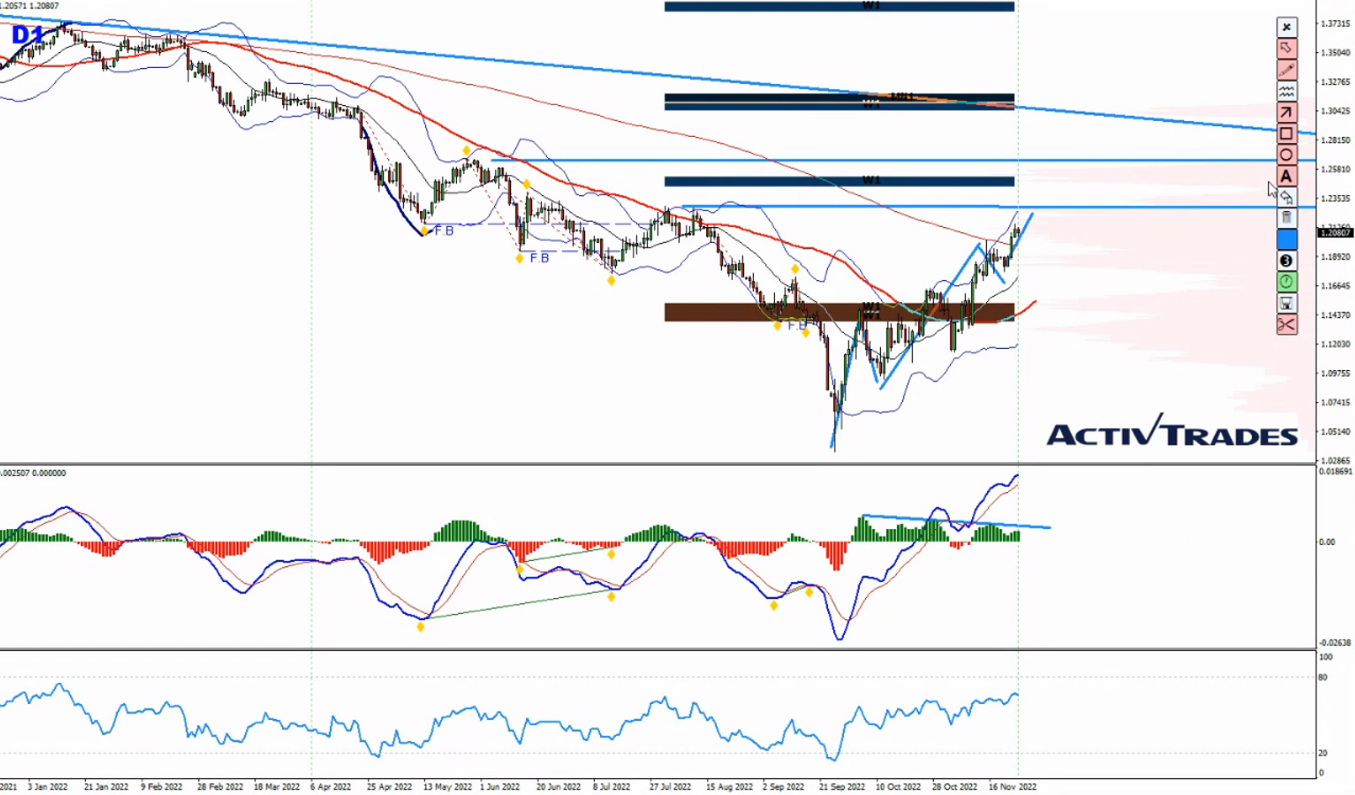
Daily time frame – On the daily chart, we can see a bearish divergence on the MACD histogram. While the price continuously creates higher highs, the highs of the MACD histogram are pointing down, which indicates losing bullish momentum and a potential bearish reversal.
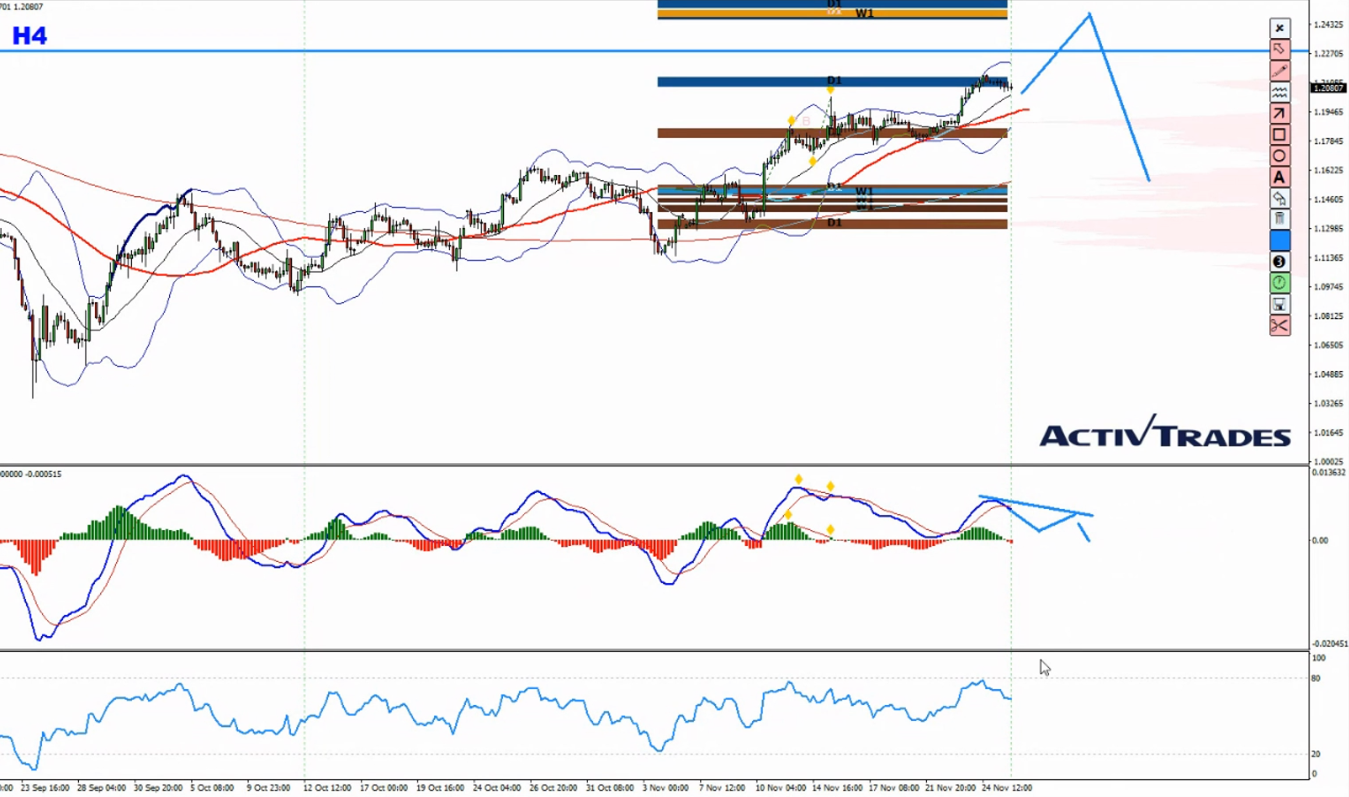
4H time frame – I believe that any rally (if happens) on the 4H that will take prices close to the resistance levels mentioned on daily and weekly time frames above should be blocked, complete a bearish divergence and bring a bearish move afterwards.
OIL
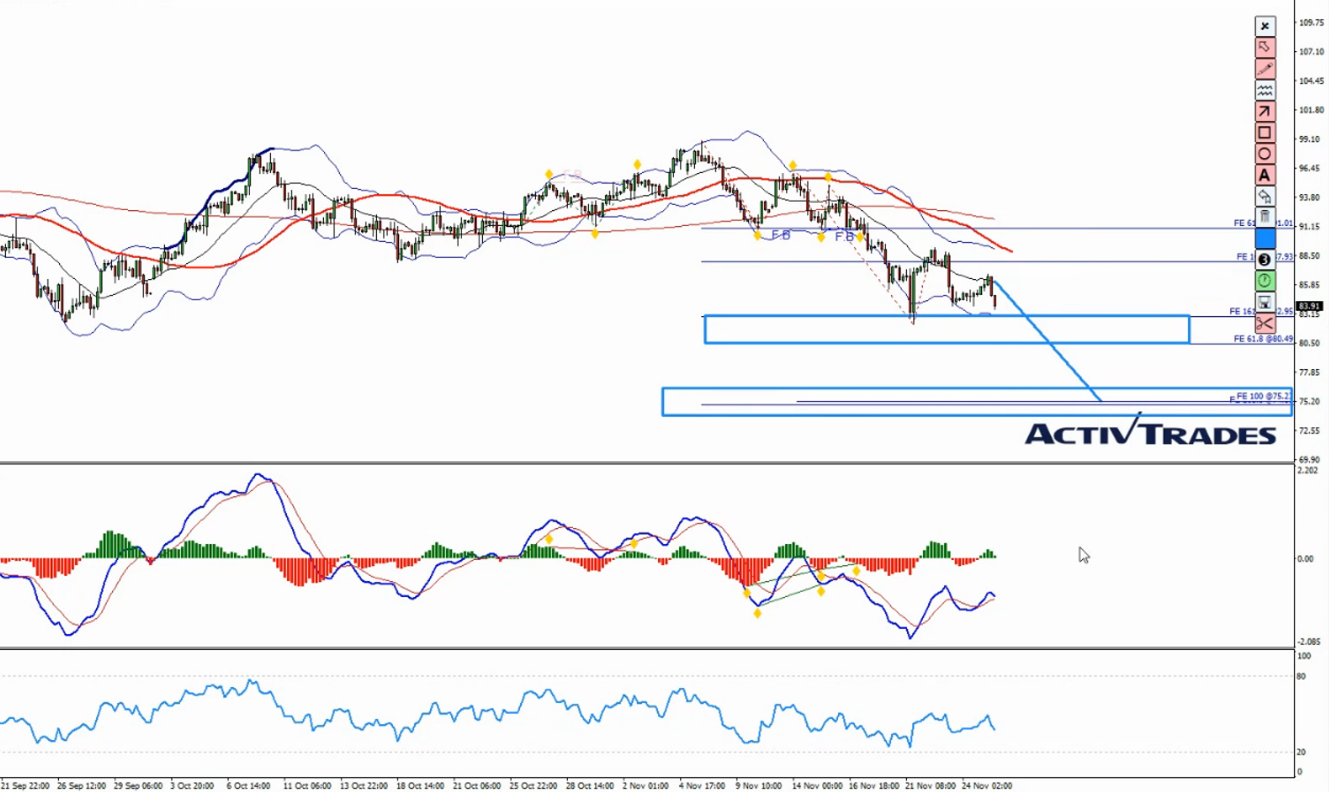
4H – The oil is building up a clean bearish cycle. A clean structure of lower highs and lower lows leaves no room for confusion – the sellers are in control. According to Fibonacci expansion levels measuring the bearish waves, we can expect Brent Oil to drop towards the 80-81 zone at the beginning of the week before a potential pullback takes place.
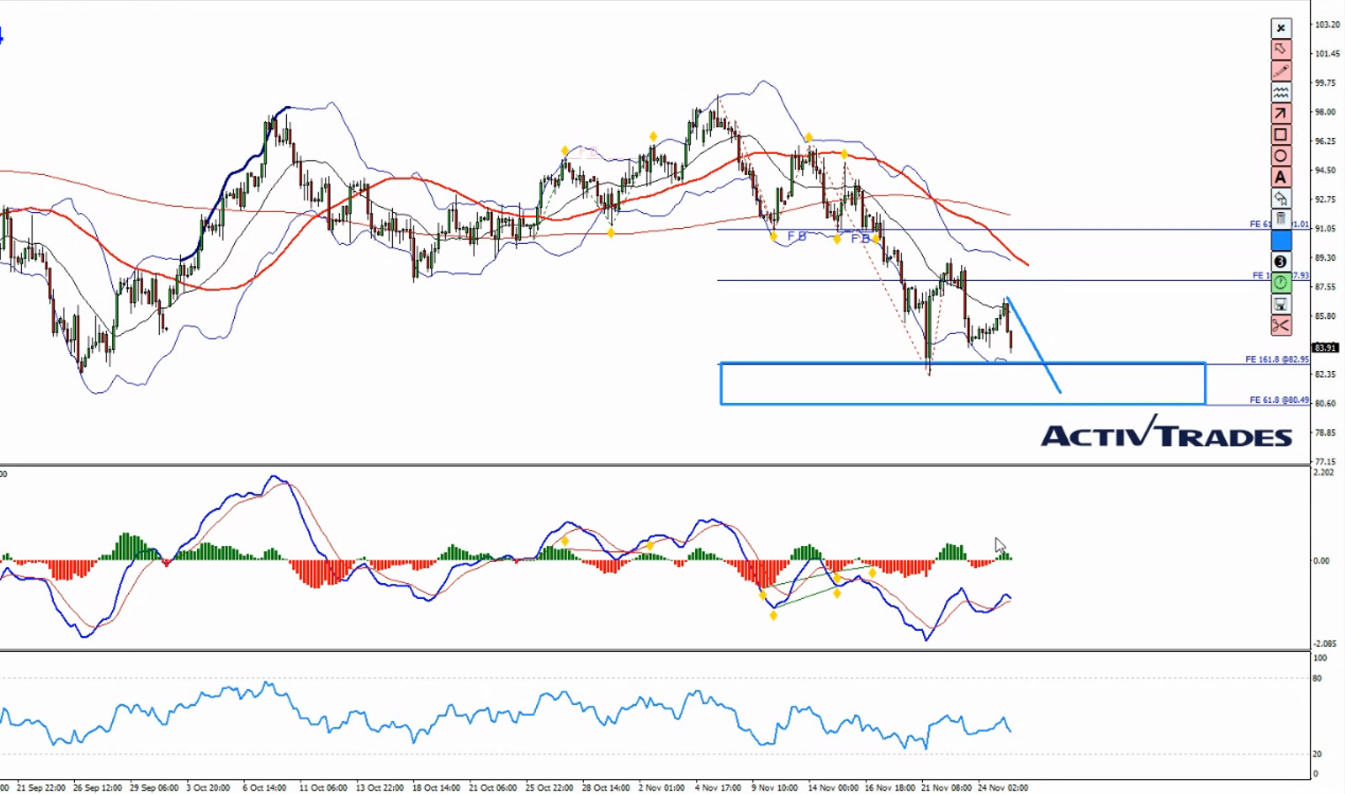
The next important levels could be found only around the 75-76 zone. I believe that if the 80-81 levels are eventually broken by the sellers, the next important levels, according to Fibonacci expansion, are 75-76 levels which will represent 100% and 161.8 Fibo expansion levels of the bearish waves.
See the image below –
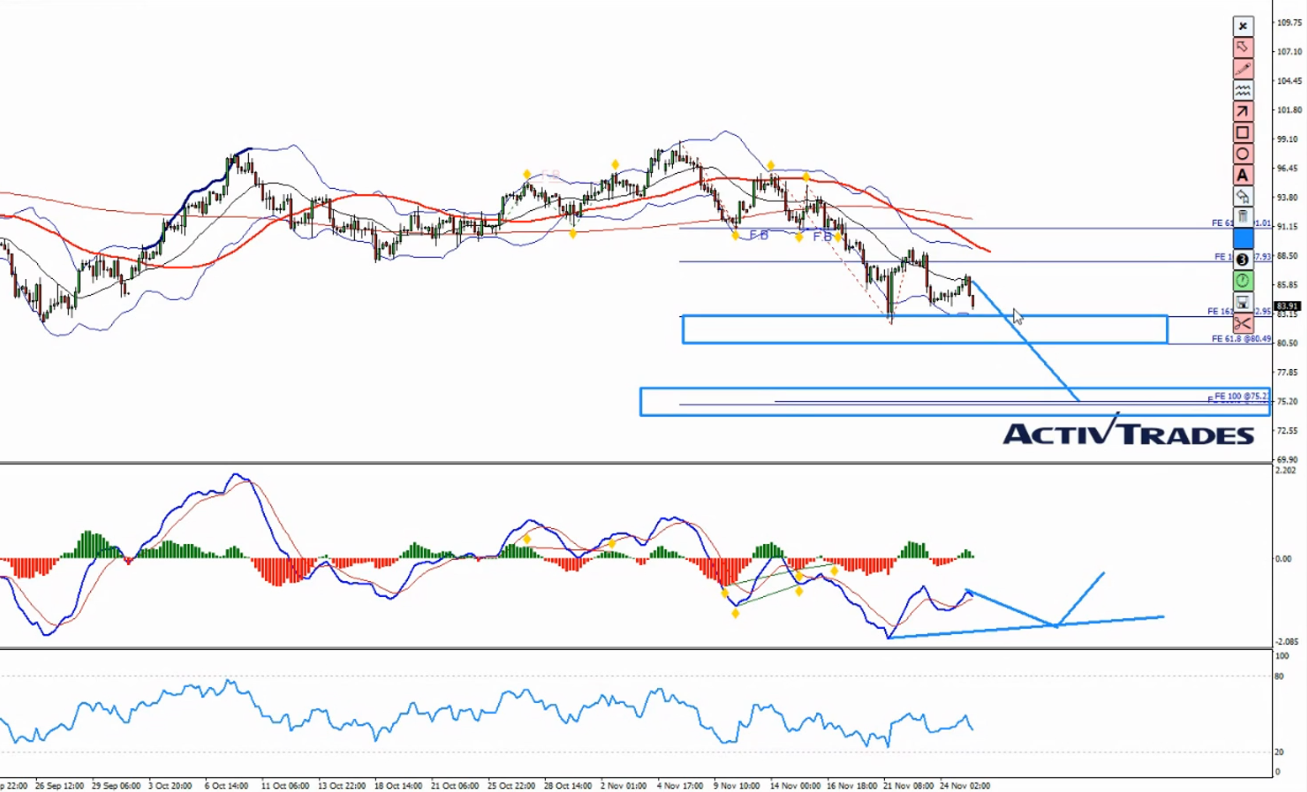
4H time frame – The end of the bearish move could be completed when one of the key zones mentioned above is reached and complete a bullish divergence. So if we see the price stops and completes its lower highs lower lows price structure and the MACD moving averages complete bullish divergence (higher lows), we can assume that the sellers will start losing the grip and a bullish price reaction is possible to follow..
That would be all for this weekly forecast. I wish you a successful trading week ahead.
Our recommended CFD broker – ActivTrades
If you have any further questions, don’t hesitate to drop a comment below!
Yours to your success,
Vladimir Ribakov
Certified Financial Technician


