
Watch the webinar of 3 Steps MACD Trading Strategy
Hi Traders! MACD (Moving Averages Convergence Divergence) is one of my favorite indicators, in this article I would like to present to you a powerful trading method based on this MACD indicator. Also, I want to show you how after analyzing the market a trading strategy could be chosen and how to work with the direction that you analyzed to trade. In order to help you understand this I have split this trading method into three simple steps which are as follows:
STEP 1 – General Analysis
Basically step 1 in my trading is always analyze the market and find my best instruments based on multi time frame analysis. Multi time frame analysis is KEY in your trading! It is not just important, it is crucial. Most if not all of my strategies apply multiple time frames synchronization and there is a clear reason for it. When I have a money flow that gives me in different timeframes and different timescales, if the flow of the money goes through the same direction then that’s where I know that my chances are bigger (there is no guarantee for a winner trade but there will be bigger probability for that trade to be a winner).
As a rule of the thumb I will perform general analysis on 2 higher time frames from the time frame that I want to trade. For example – if I want to trade the hourly chart, I will see what is the current picture on the Daily chart. A general analysis starts with basic analysis of current market trends. To make it very simple – if the the price is making higher highs and higher lows (bullish trend) or lower lows and lower highs (bearish trend), is the price close to key support resistance levels, pivot levels, whether the price is above or below the 200 Moving Average, trend lines and other price action formations.
STEP 2 – MACD Direction
The next step here is to find the direction of the MACD indicator. I’m using MACD in this specific strategy in two different ways to find the direction.
- MACD’s Histogram – creating higher highs (bullish) or lower lows (bearish)
- MACD’s Moving Averages – cross down (bearish or cross up (bullish)
At this stage we know that not only the higher time frame suggests bullish or bearish direction, we know that the lower time frame is pointing at the same direction. This is the time to start looking for potential entries.
STEP 3 – Entries
The third step here is to look for entries. I love to confirm what the indicators and general analysis are saying by price action. The 3 higher highs/ higher lows (alternatively 3 lower lows/ lower highs) pattern works charming! It is exactly that in combination with hidden divergence that makes a perfect entry trigger.
Example
To explain this strategy in action I will take an example (GBPAUD) from my Traders Academy Club report.
On the table below you can see my trading watch list. This list is all the trading opportunities I share with my followers on daily basis, in Traders Academy Club (you can join us here).
So in GBPAUD my plan after analysis was straight forward that is to look for correction, and we expect continuation lower with clear invalidation plan for this whole idea which would be the most recent downtrend line shown in the screenshot below.
Step 1 – General Analysis
The very first thing that we can see on the daily chart is that the price was going up, and then it was going down. Can you say we have a clear picture in the last one year? The answer is no but the bottom line here is that almost since the beginning of this year the price is going down pretty significantly.
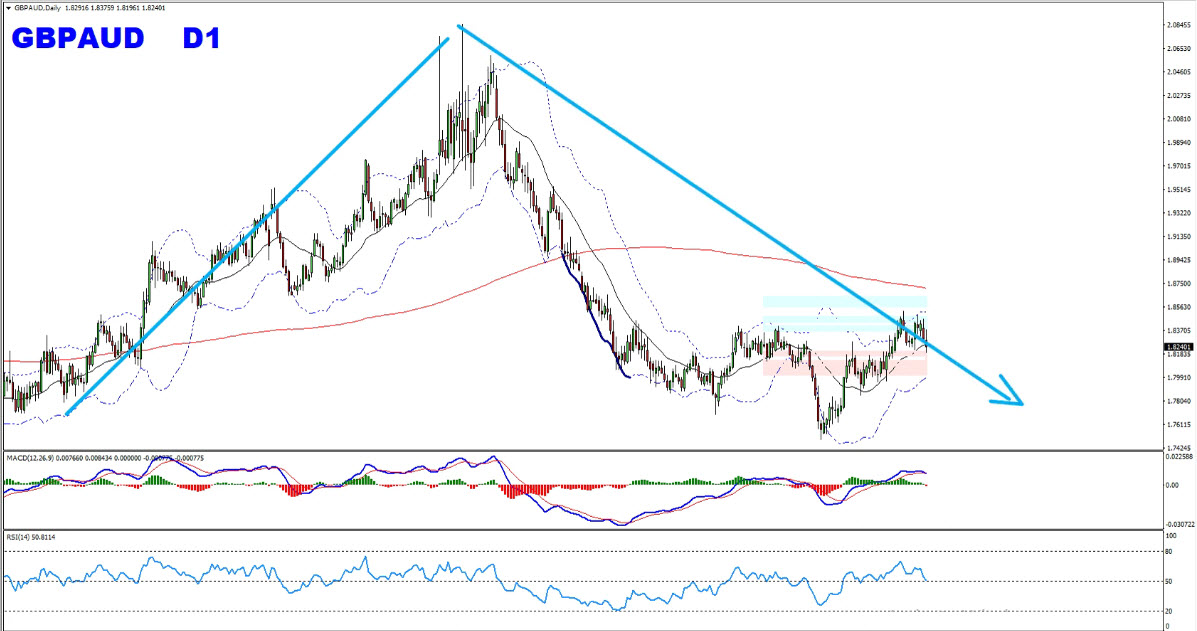 The next step here is to look for the key levels we have, and we can see that the price has retested the level shown in the screenshot below which makes it a strong key level for us. It was a great resistance which later became a support area, and it’s also a great level of rejection and was holding many times as you can see in the screenshot below.
 Also, the dynamic resistance of the 200 moving averages (the red line that you can see in the screenshot below) is also bearish (negative slope) which indicates the pressure here is bearish.
 Basically I did this analysis to understand where the momentum is on the bigger picture.
Step 2 – MACD Direction
Now the next step is to look for the direction of the MACD indicator. Here is what I am looking for on the MACD to find where the momentum is on the multi-timeframe:
Looking at the MACD indicator we could see that the price is trying to climb up on the chart but the MACD doesn’t follow the same. It means that the market managed to create on this little rally since the middle of September. So the market managed to create higher highs, higher lows but the MACD has created lower highs, this means that the bullish momentum is losing and weakening..
 Besides, we could see that the price already experienced an attempt to cross from the positive area to the negative area on the moving averages of the MACD indicator. This indicates that something is going on here – and likely the buyers are leaving the pair.
 Moving down to one timeframe lower on the H4 chart we can see on the MACD indicator that we have a significant cross down starting from the area shown in the screenshot below, and it enters the negative zone.
 Moreover, after the bullish rally which was created in the form of higher highs, higher lows, for the first time it looks like the price has created lower highs, lower lows.
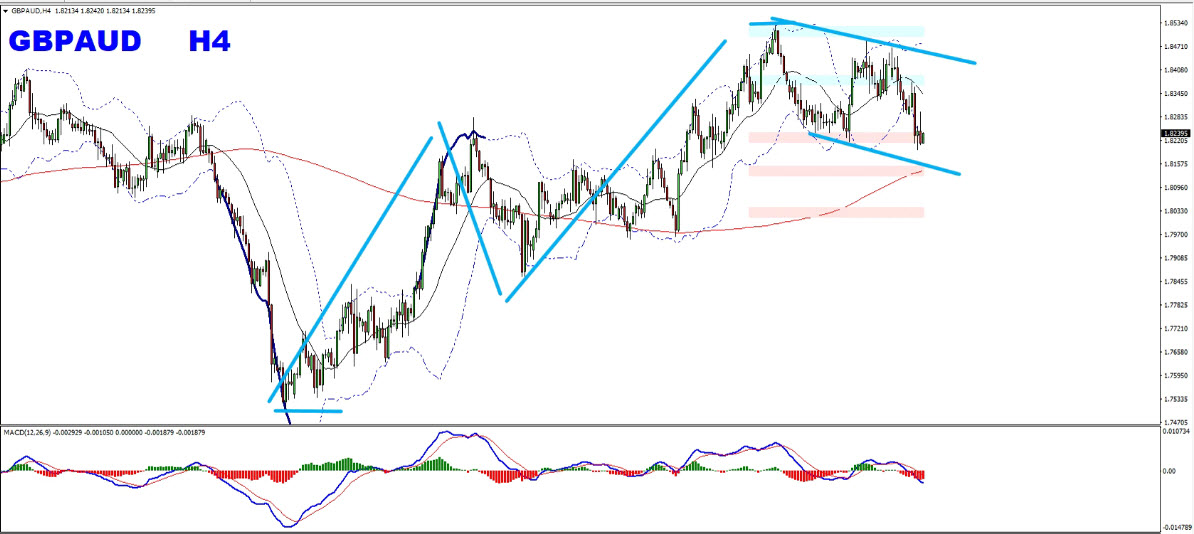 So adding this to the daily general analysis we have a bearish pressure is that enough for a trade? The answer basically is yes. BUT – we can now start and look for better timing opportunities to improve our risk reward ratio and timing of entering the trade. And this is where I like to go to the third lower timeframe, in this case the H1 chart.
Step 3 – Entries
Looking at the H1 chart we could see the price is creating lower highs, lower lows pattern and mainly the momentum is synchronized with the MACD indicator (As you can see in the screenshot below the MACD is pushing down and making lower lows together with the chart).
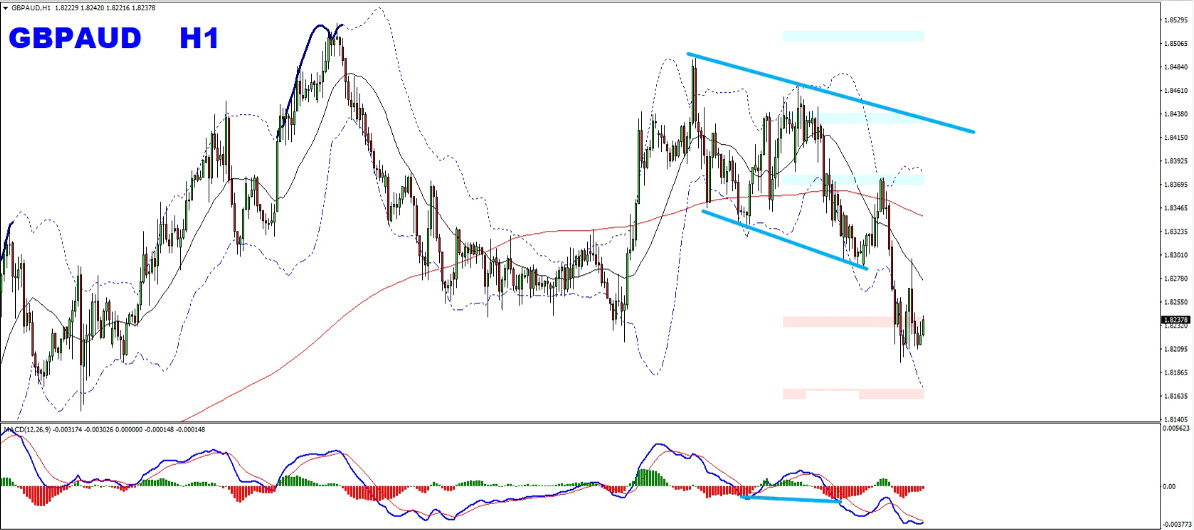 And from this area, I will be looking for retraces in order to join the sells.
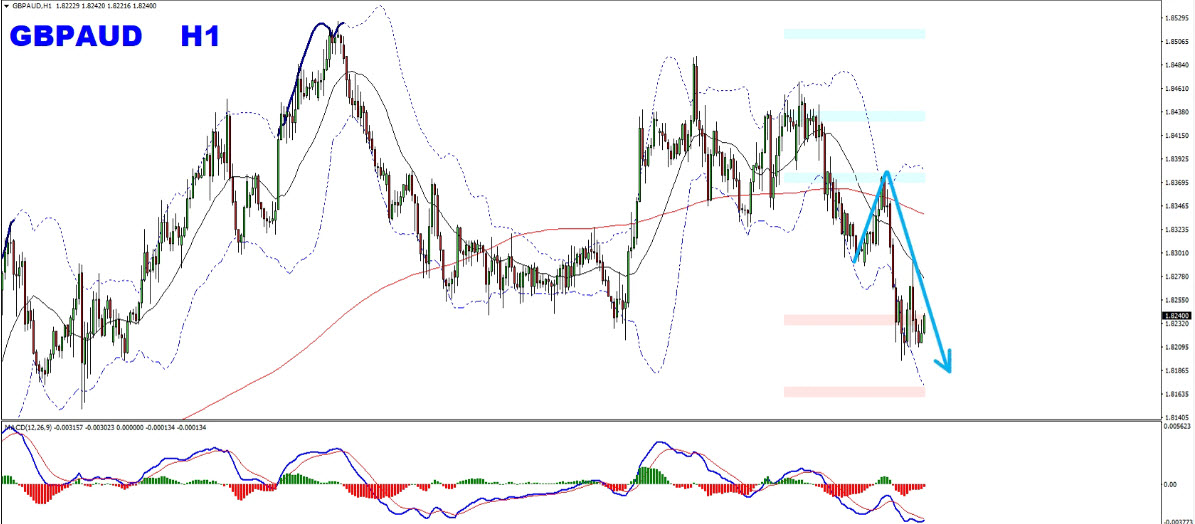 This was exactly my plan which I showed you earlier and what you want to look here is an opportunity to enter the sells. Basically the idea here is after you made your analysis and after you synchronized the timeframes, find the strategy that you want to enter the trade.
 One of the techniques that I work with which could be applied here is the hidden divergence. If you purely work with the MACD then this is where you got the bearish hidden divergence hinting for a trend continuation as shown in the screenshot below.
Note: If you want to learn more in-depth insights about divergences, you can benefit greatly from the videos on my channel here while also embarking upon Divergence University for comprehensive divergence education.
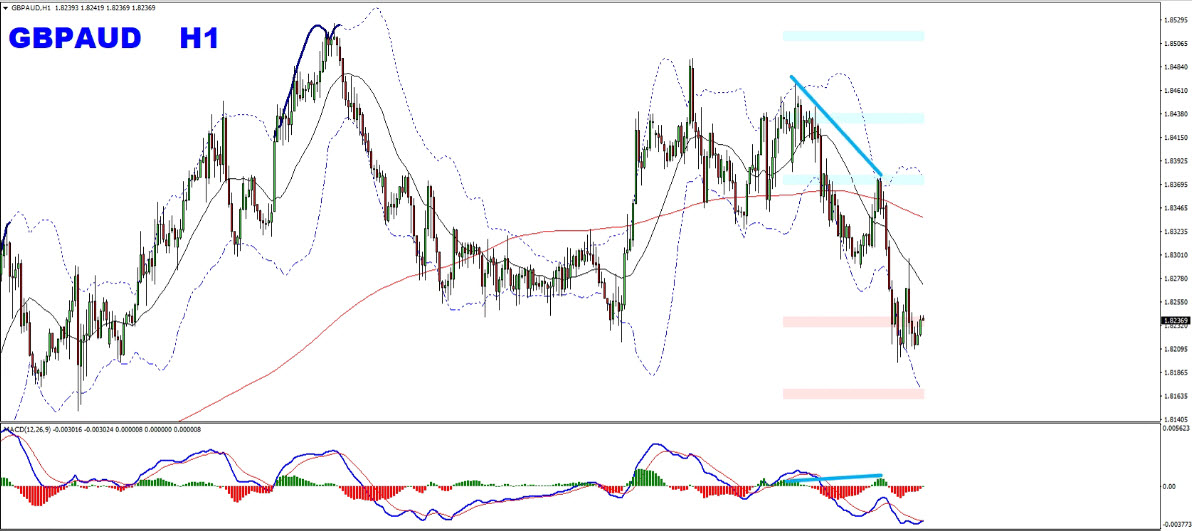 At this moment once we do have the MACD in play another technique which I like to apply here is to go and verify waves. I like to see here are the waves pushing in the bearish direction (series of lower highs, lower lows). We had the series of lower highs, lower lows here followed by a pullback and a key zone of rejection which resisted the price, and we can also see that the dynamic 200 moving averages is very bearish. So the bottom line here is that there is nothing bullish.
 From this moment you can mark the ABCD pattern and the most recent uptrend line and break below this would be a sign to enter the sells. You can also work with the pure rejection zones that you have but mainly just make sure you protect yourself.
 Upon the H1 chart I had the invalidation as the downtrend line as I showed you before and if you trade the lower timeframe then you can use the previous rejection levels as invalidation and use it as a protection. And for the targets you can use significant levels for example swing low or the next key supportive area as shown in the screenshot below. This is where you have to find the possible targets when you work with such trades.
Conclusion
So traders these are the steps involved in this specific super powerful MACD trading strategy. First of all pre-analysis and then general analysis, just what your eyes catches and see whether you have key levels. If you have these levels then you should catch them without going into details, like the trend lines, supports, resistances, round numbers, pivot levels, etc.. You can then start to apply the MACD strategy. You want the MACD to support your direction it could be with the momentum or with crossing the moving averages and then the divergences could come into play. My favorite style is the combination of divergence with waves. So this is my suggestion when you work with the MACD indicator. Just don’t purely rely on the indicator saying it will be fine, make sure that the price behavior supports your analysis. As much as I love the indicators by myself especially the MACD it is important to remember that the job of the indicators is just to indicate and not to make a decision out of it, remember this the next time when you consider your trade.
Once again I invite you to join me in my club and enjoy from our Live Market Analysis and our trading reports on a daily basis and improve your trading with us.
Also, you can get one of my strategies free of charge. You will find all the details here
Thank you for your time in reading this article.
Yours to success,
Vladimir Ribakov
Certified Financial Technician

