


The Aussie Dollar faced a lot of selling pressure today against most major currencies, including the US Dollar and
the Japanese yen. One of the key Aussie Dollar pairs AUDJPY is showing us a lot of signs of a downside move in the
near term. So, let us try to analyze and see how the pair may trade in the near term.
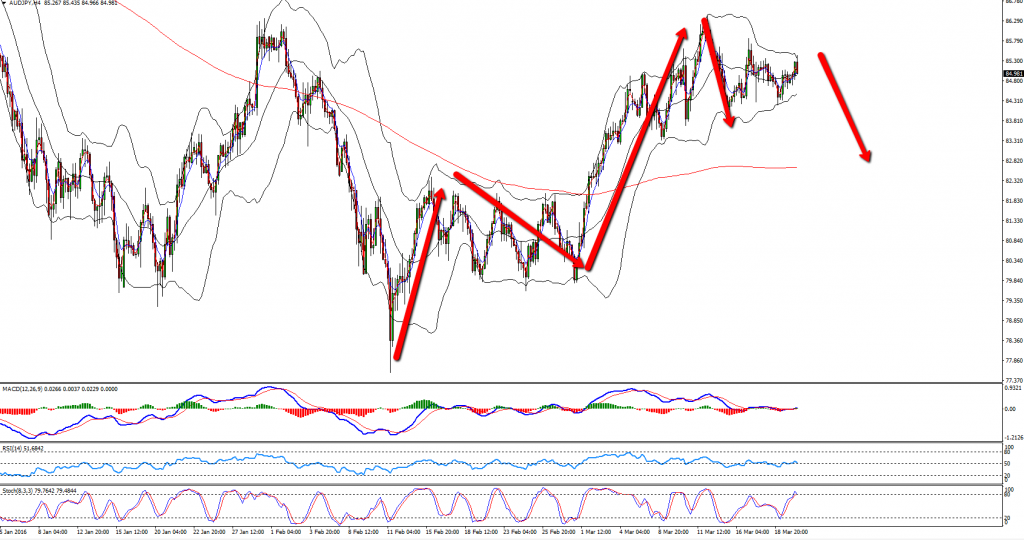
If we look at the 4-hours chart, then there is a chance that the AUDJPY pair is on the verge of completing an upside
move. It almost completed 3 waves from the bottom and setting up for a consolidation pattern for the next move,
which can be a downside move.
I think it is best for look for a sell trade in the AUDJPY pair, and for that we can drop on a lower timeframe chart for
an entry.
Technical Analysis
H4 – The 4-hours chart of the AUDJPY pair is pointing a downside move as mentioned. The pair likely completed a
3 waves up patter and may trade lower in the near term as shown in the chart attached.
Sell Entry:
H1 – If we look at the hourly chart of the AUDJPY pair, then there is a contracting triangle pattern forming, which
can be seen as a breakout pattern for the next move. There is also a bullish trend line on the same chart inside the
triangle, which can act as a pivot for a sell trade. If the pair closes below the highlighted trend line support area,
then we can enter a sell trade once the pair retests the same trend line.
Alternately, we can enter a sell trade around the triangle resistance area if the pair continues to trade higher.
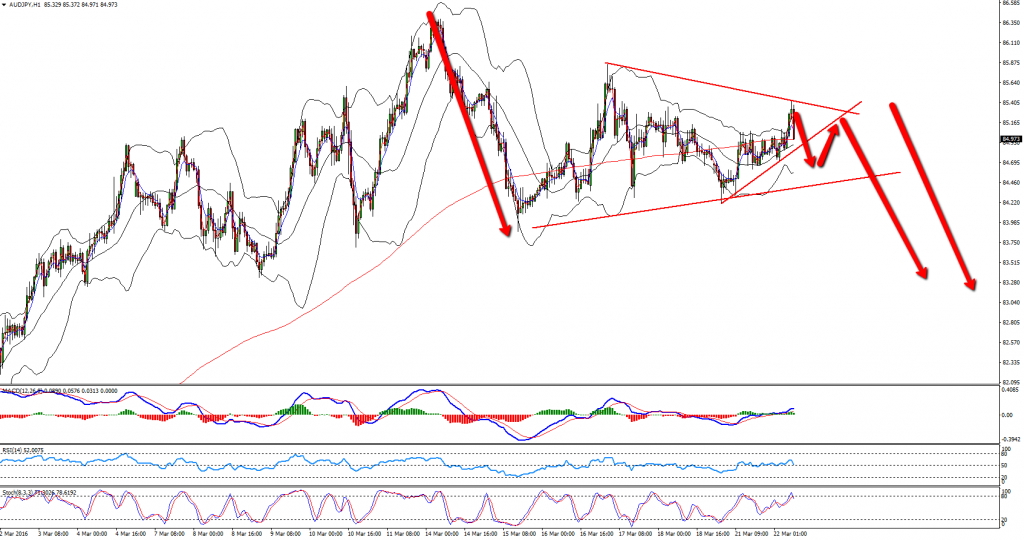
Target 1: 83.70
Target 2: 83.40
Stop Loss: 15 pips + above the triangle resistance area.
Fundamental events recap and Economic news to watch out
Today in Australia, the House Price Index, which evaluates and points out the changes in housing prices of major
cities in Australia was published by the Australian Bureau of Statistics. The market was expecting no change in the
price index (0%) in the fourth quarter of 2015, compared with the third quarter of 2015.
However, the outcome was above the forecast, as the House Price Index increased by 0.2% in Q4 2015. When we
look at the year-over- year change, then the Australian House Price Index registered a gain of 8.7% in the fourth
quarter of 2015, compared with the same quarter of the preceding year.
The report highlighted that “the total value of residential dwellings in Australia was $5,885,967.2m at the end of
December quarter 2015, rising $31,557.1m over the quarter. The mean price of residential dwellings rose $800 to
$612,100 and the number of residential dwellings rose by 38,700 to 9,615,800 in the December quarter 2015”.
Today, the US Manufacturing Purchasing Managers Index (PMI) will be released by the Markit Economics, which
may impact the movements in the market.
I think the AUDJPY pair trade idea looks good and if we stick to the plan it might render good gains for us in the
short term.
Good Luck with trading today traders!


