


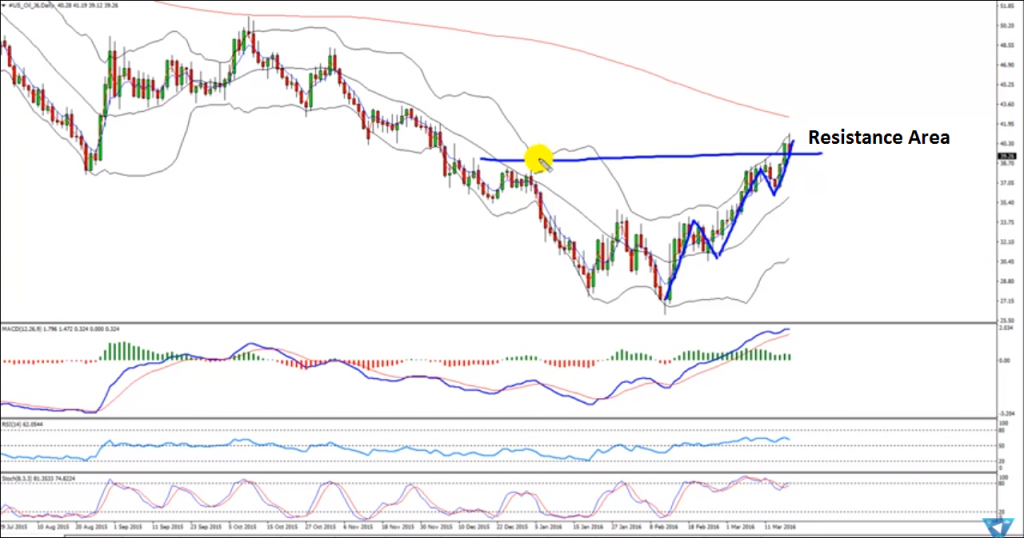
Oil prices enjoyed a nasty recovery this past week, and one of the top reasons for the upside move was the weakening US Dollar. The greenback fell sharply this past week, which caused oil prices to move higher. The daily chart of oil clearly portraits the strength of the bulls. However, I think we need to be very careful moving ahead, as the prices may be heading towards a major resistance area.
There is a chance that the price is completing an upside leg in three waves and may form a short-term top soon. So, I think we should explore lower timeframe charts and start looking for a sell opportunity moving ahead.
There is a major resistance near $41.00-$42.00, which may act as a barrier for more gains and ignite a downside move. One important point to note is the fact that the price is below the 100-day simple moving average, which can also be seen as a resistance area.
Technical Analysis
D1 – If we look at the daily chart, then it looks like the price is heading towards a major resistance near $41.00-$42.00. If the bears start to step in, there is a real chance of oil price moving down in the short term.
Sell Entry:
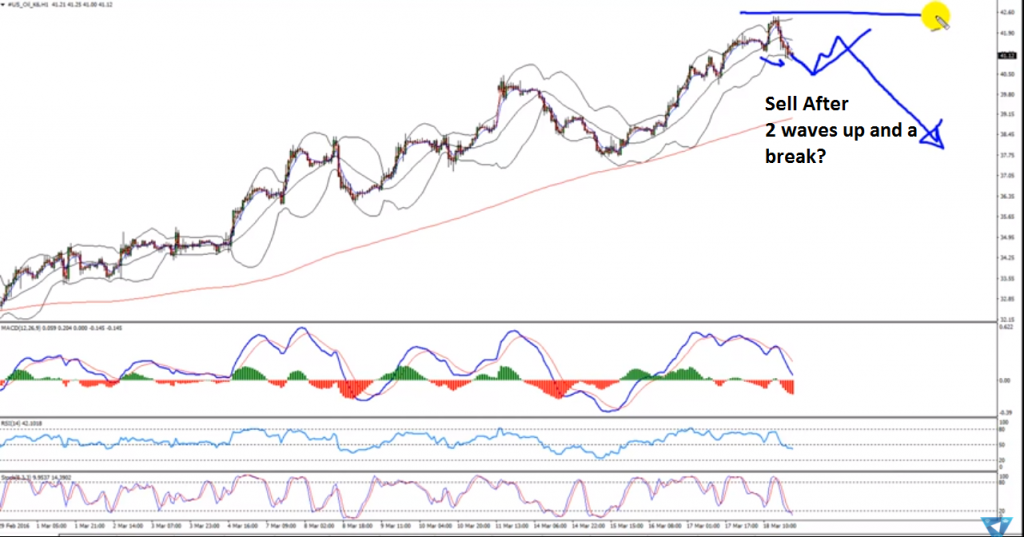
H1 – If we look at the hourly chart of oil price, then there is a convergence forming, which means there is chance of prices correcting higher in two waves either from the current levels or from a bit lower levels. If the stated scenario happens, then we can plan on entering a sell trade. We will wait for the price to move higher in two waves, and once it forms a trend line support area, then we can enter a sell trade once the price breaks it and closes below it.
Target 1: $39.20
Target 2: $38.50
Stop Loss: Above the last high of $42.60
Fundamentals events and Economic news to watch out
One important aspect to note is that the recent trend was strong for oil prices, as it moved up and created a new high for the past 3½ months. However, the upside move was hit by a major data release this past week on Friday. The US oil rig count was released. The report stated that Baker Hughes oil rig count rose by 1 rig to 387 rigs. This escalated tension and paused the rise in oil prices. It not only stalled the upside move, but also ignited a downside reaction.
Today in the US, there are a couple of low risk economic releases lined up, including the existing home sales and the Chicago Fed National Activity Index (CFNAI).
The US Existing Home Sales that provides an estimated value of housing market conditions will be released by the National Association of Realtors. The forecast is slated for a reading of 5.40M in Feb 2016, compared with the previous month. If the result fails to match the forecast, then the US Dollar may come under some pressure.
Overall, it looks like oil prices may surprise traders and depends on a lot of speculative moves. Let’s see how it trades moving ahead and whether it can align itself as per our sell idea or not.
Good luck traders!
Yours,
Vladimir


