




Hi Traders! Arvinth here from the Home Trader Club team. The weekly summary and, review of May 29th 2026 is here. It is now time to recap and summarize the trade setups that we had during this week. Below you will find a short explanation of all the trade setups we had this week and how it has currently developed now.
 Join the Home Trader Club
Want to access the tools, systems, and real-time education we use daily?
With AvaTrade Broker’s support, you can now enjoy up to one full year of access to the Home Trader Club — including:
-
All professional trading systems
-
Access to our new project, the Home Trader Club trade copier, where our traders trade and you can copy.
-
Real-time trade ideas and setups
-
Full access to our course library and trading marketplace
 Join here: https://tracking.avapartner.com/dR0AAA
Trading Ideas (Blog Posts)
Ethereum – My idea here was “On the H1 chart, we have a strong bearish momentum and also currently it looks like a pullback is happening and there are no signs opposing this short term bearish view. So everything looks good for the bears here as well. In addition to this, we have three key resistance zones that has formed based on the volume profile zones of the KTLI indicator and the Triple B Pro pivot levels. Until these three key resistance zones shown in the image below (marked in red) holds my short term view remains bearish here and I expect the price to move lower further after retraces”.
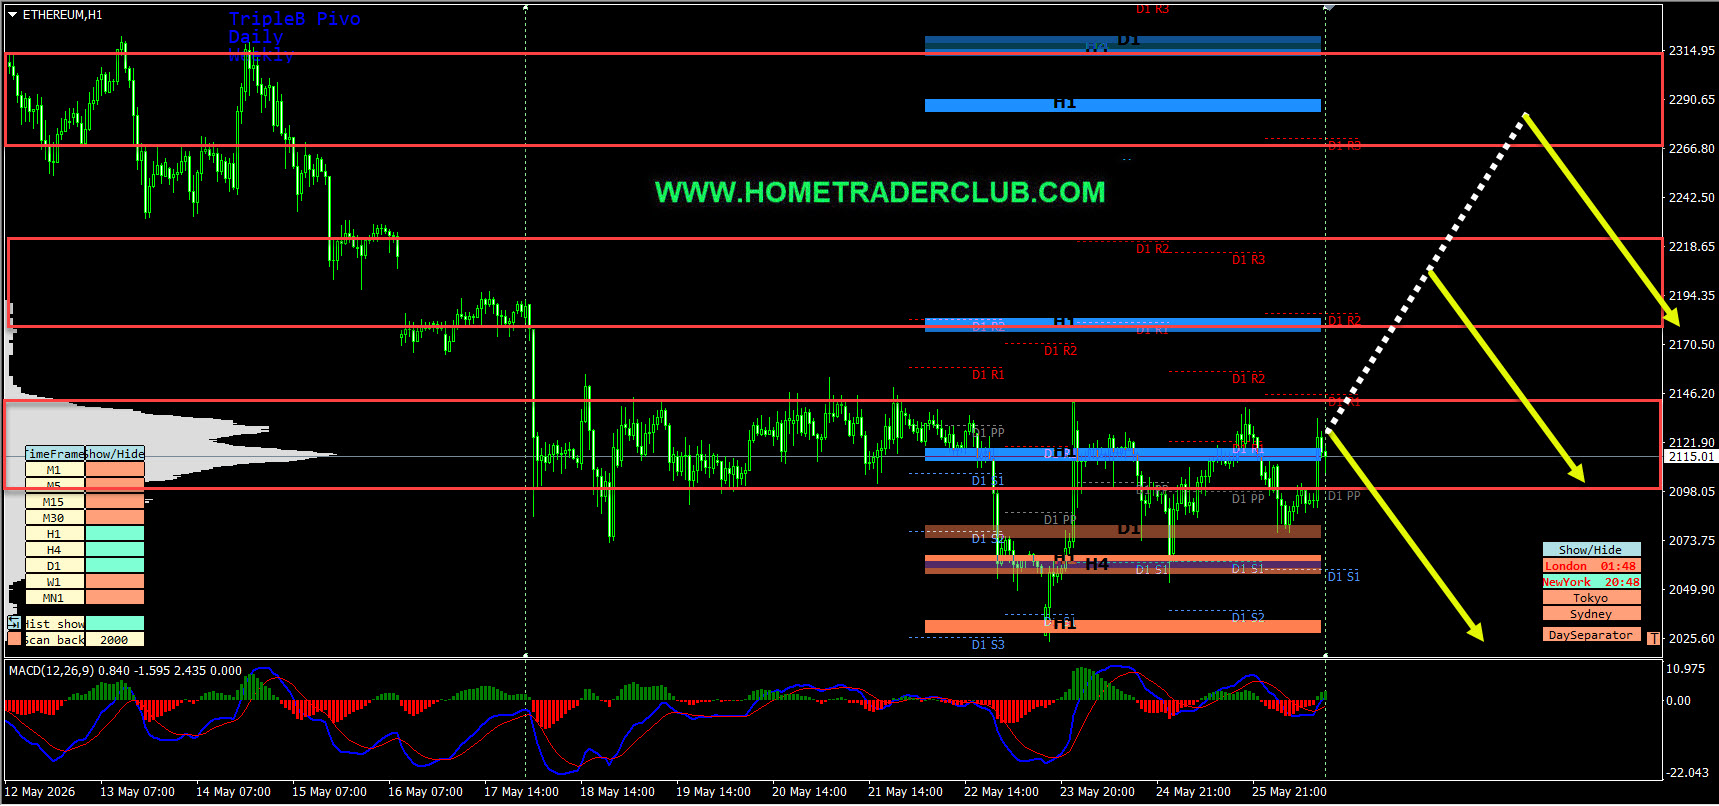
Current Scenario – In Ethereum, based on the above-mentioned analysis, until the three key resistance zones hold I was expecting short term bearish moves to happen here. The price respected the second key resistance zone and then moved lower as expected and provided a nice move to the downside as you can see in the image below!

AUDUSD – My idea here was “On the H1 chart, we have a strong bearish momentum and also currently it looks like a pullback is happening and there are no signs opposing this short term bearish view. So everything looks good for the bears here as well. In addition to this, we have two key resistance zones that has formed based on the volume profile zones of the KTLI indicator and the Triple B Pro pivot levels. Until both these key resistance zones shown in the image below (marked in red) holds my short term view remains bearish here and I expect the price to move lower further after retraces”.
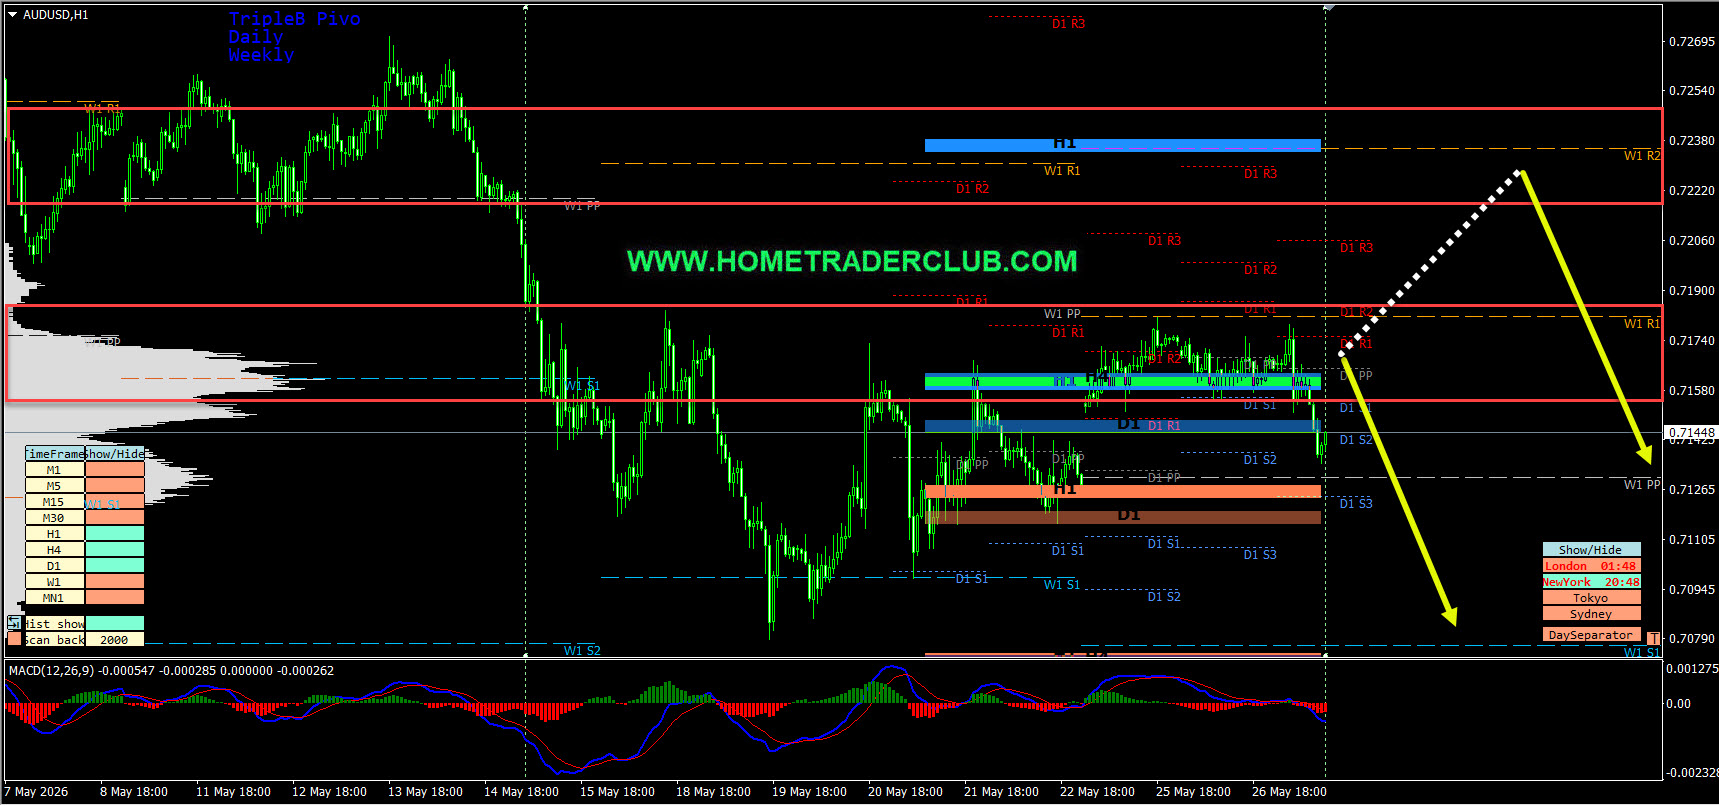
Current Scenario – My plan didn’t change in AUDUSD, that is until the two key resistance zones hold my short-term view still remains bearish here and I expect the price to move lower further.

EURNZD – My idea here was “On the H1 chart, we have a strong bearish momentum and also currently it looks like a pullback is happening and there are no signs opposing this short term bearish view. So everything looks good for the bears here as well. In addition to this, we have three key resistance zones that has formed based on the volume profile zones of the KTLI indicator and the Triple B Pro pivot levels. Until these three key resistance zones shown in the image below (marked in red) holds my short term view remains bearish here and I expect the price to move lower further after retraces”.
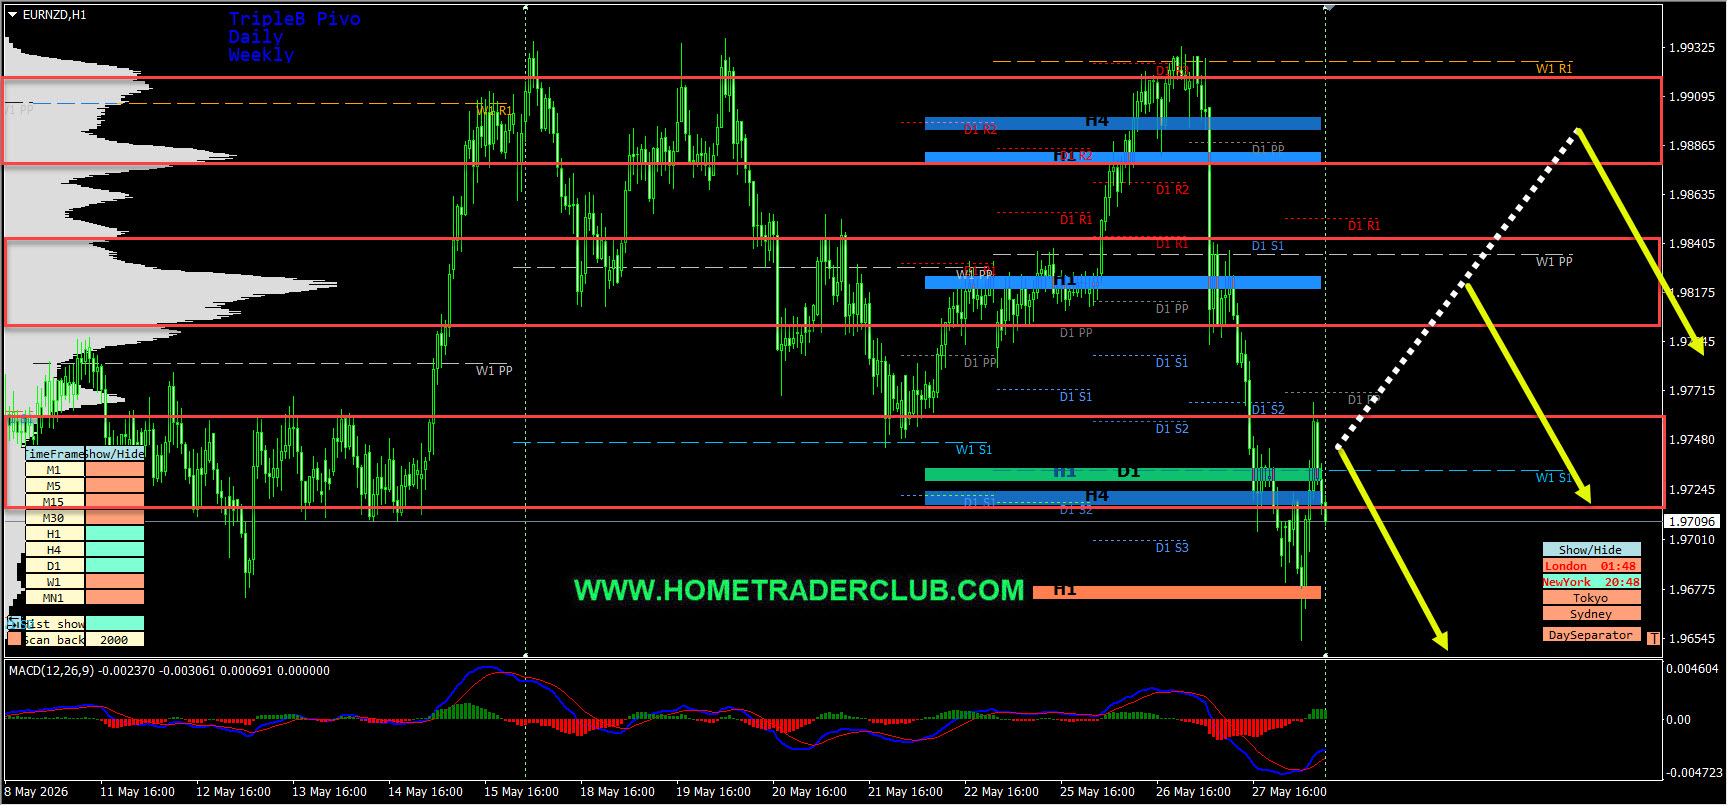
Current Scenario – In EURNZD, the price action followed my analysis exactly as I expected it to. The price respected the first key resistance zone and then moved lower as expected and provided an excellent move to the downside as you can see in the image below!

For similar trade ideas and much more I invite you to join the Home Trader Club and improve your trading with us.
You will also find a pretty extensive database of educational materials here in the blog – just use the search or check out the Forex Education section above.
If you have any further questions, don’t hesitate to drop a comment below!
Happy Trading!
Arvinth Akash
Home Trader Club Team.