


Hi Traders! Ethereum short term forecast follow up and update is here. On February 13th, 2024 I shared this “Ethereum Short Term Forecast And Technical Analysis” post in our blog. In this post, let’s do a recap of this setup and see how it has developed now. If you would like to learn more about the way we trade and the technical analysis we use then check out the Home Trader Club. Spoiler alert – free memberships are available!
My Idea
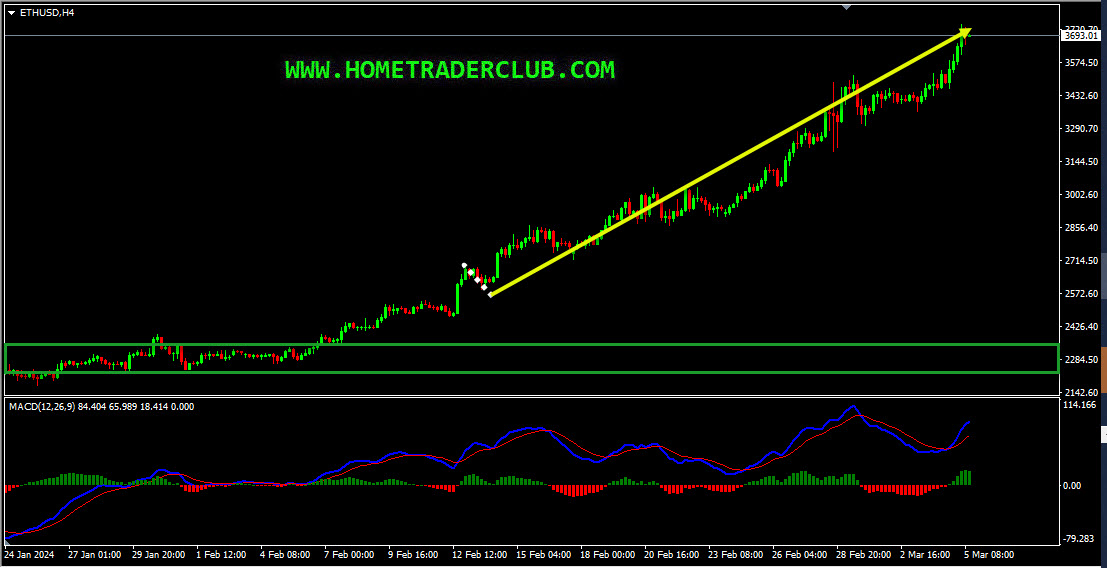
On the H4 chart, based on the Heikin Ashi candles we can see that currently, we have strong bullish bodies in upward moving market conditions so it basically reflects a bullish environment. Also, the price which is moving higher has created a bullish trend pattern in the form of three higher highs, higher lows, we may consider this as another evidence of bullish pressure. Generally, after a bullish trend pattern, we may expect corrections and then potential continuation higher. Also, we could see that the price which is moving higher has created higher highs based on the MACD indicator, which is a sign of gaining momentum towards the bullish side. In addition to this, the ADX indicator gave a bullish signal here at the cross of +DI (green line) versus -DI (red line) and the main signal line (silver line) reads value over 25, we may consider this as yet another evidence of bullish pressure. So everything looks good here for the bulls and until the strong support zone (marked in green) shown in the image below holds my short-term view remains bullish here and I expect the price to move higher further after pullbacks.

Ethereum H4(4 Hours) Chart Current Scenario
On the H4 chart, based on the above-mentioned analysis my short-term view was bullish here and I was expecting the price to move higher further after pullbacks until the strong support zone holds. The price action followed my analysis exactly as I expected it to here. After the higher highs, the pullback that I was looking for happened and then the price moved higher further as I expected it and delivered a fantastic move to the upside!
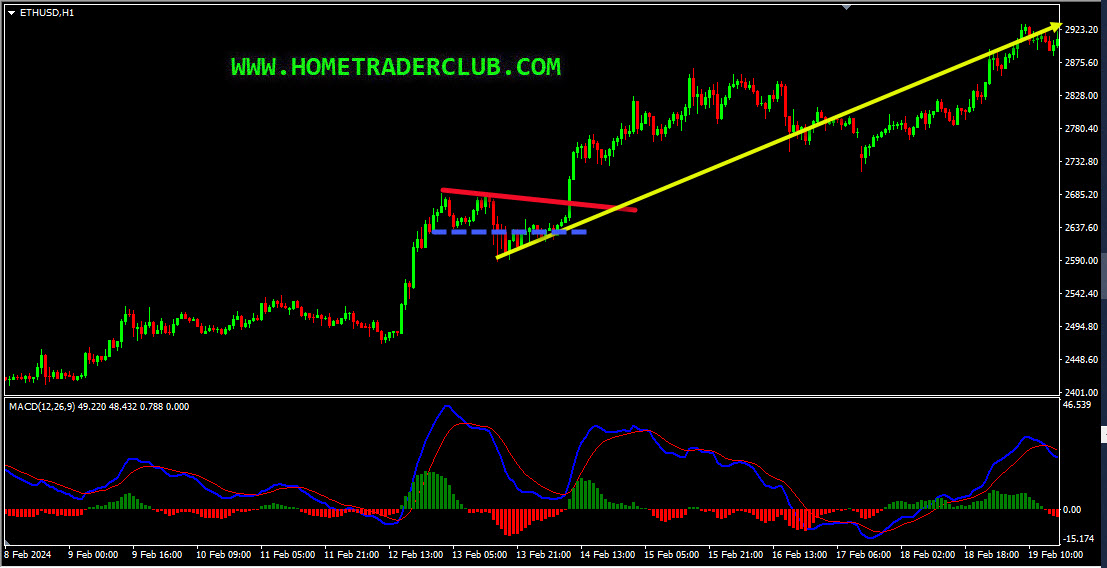
On the H1 chart, the market provided us with various facts supporting the bullish view. The price which was moving lower created a false break of the last low at 2636.09. In addition to this, the price then moved higher and broke above the most recent downtrend line. We may consider these as facts provided by the market supporting the bullish view. Then as you can see in the image below how the price moved higher after that and provided a fantastic move to the upside!
As traders we always have two choices, the first one is to fall in love with our analysis and try to convince the market and expect the price to move in the direction as per our wish. The second one is to follow the facts that the market provides us and make the right actions according to that. As you know the first option won’t help us and as you can see in the example above what happened when we followed the facts that the market hinted to us and took the right action according to that.
For similar trade ideas and much more I invite you to
Also, you can get one of our strategies free of charge. You will find all the details here
Download our best forex indicators here
If you have any further questions, don’t hesitate to drop a comment below!
Happy Trading!
Arvinth Akash
Home Trader Club Team.


