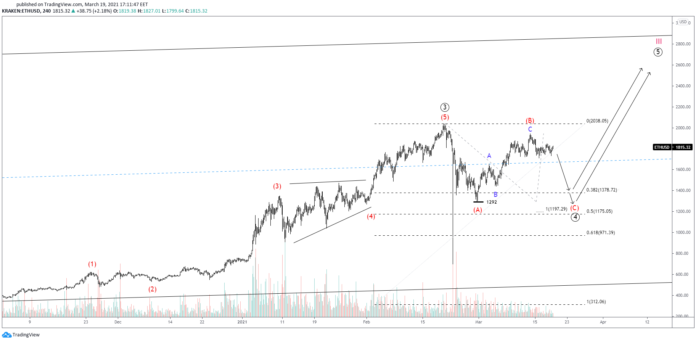
The prices of Ethereum remain bullish in the medium and long term as we are only trading in cycle wave III. In addition, ETHUSD is currently on an impulsive ride, trading above the mean regression (blue dashedline) of the cycle-degree ascending channel. However, the short term trajectory of ETH comes with its perks. Let’s clear the picture out a little bitby examining a couple of probable scenarios.
Flat and Zigzag Both Probable Scenarios
In my main scenario, and despite the structure from the low of $1292 being impulsive, when adding the decline from the all-time-high of $2038 in the picture, the structure reminds both a regular flat and a simple zigzag pattern.
Flats are made of a 3-3-5 pattern, currently seen in the intermediate degree (A)(B)(C) correction. With waves (A) and (B) complete, prices could start falling towards the previous low in wave (C).
Simple zigzags, on the other hand, are made of a 5-3-5 pattern, as seen in the same degree.
How Does the Forecast Change?
The difference between the two is that in the former case, prices can be expected to reach a local low, form a double bottom near $1292 and shoot higher. Whereas in the latter case, prices can be expected to register a fresh low.
Most often, simple zigzags extend 100% of waves one and two (or (A) and (B) in this case). This brings us to a low of $1197, which happens to be very near the 50% Fibonacci retracement of primary wave ③,thus, making that a cluster.
5-Wave Impulse Could Send Us to ATH
In my alternative scenario, and since (as mentioned earlier) the structure from the low of $1292 is impulsive, the correction could have already ended with a double three pattern. As such, the recent correction from minor wave 3 (blue), is only part of a 5-wave impulse in intermediate wave (1).
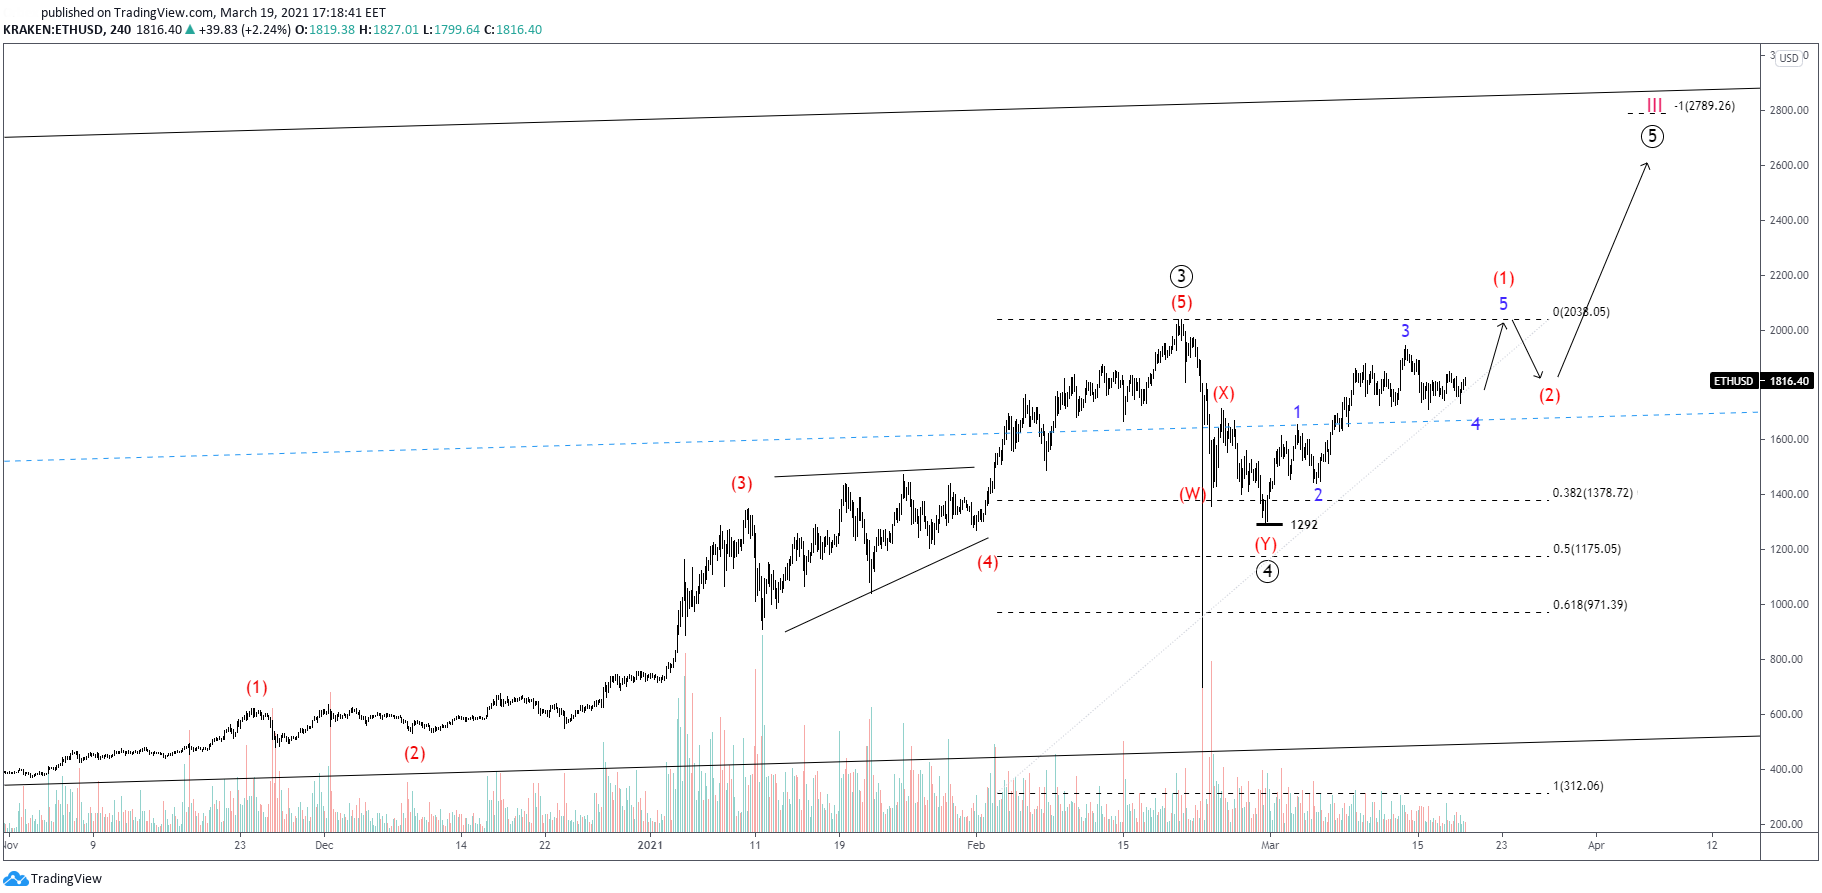 Should the double three pattern remain intact, prices are in for a rally towards $2789. This marks the 100% Fibonacci expansion of $1292 and $2038 – assuming of course wave (1) completes at the said local top – and is very near the top line of the cycle-degree regression channel.
What Signals Should I Look For?
With primary wave ② registering a 50% correction, it is relatively hard to use the rule of alternation to guestimate how deep the correction in primary wave ④ could be. Therefore, any of the scenarios could take place. In the short-term, attention should remain on the break above blue 3 or below blue 1.
About the Author
 Stavros is an licensed Forex professional, currently heading the investment research team at a reputable broker. He has demonstrated history in proprietary trading, Elliott Wave analysis and educational content writing. He is seen writing in the best sites for traders.
You can follow Stavros on Twitter and Linkedin here: twitter.com/StavrosTousios & linkedin.com/in/stavrostousios/

