


Those of you who have been following me for some time, know very well that i’m a technical analyst and even though I’m always aware of the fundamentals, my trades are based on the technicals. The “beef”, if we can call it this way, between fundamental and technical analysts is a question with no clear answer. Kind of like which comes first – the egg or the chicken.
For some one works better, for others is vice versa. At the end of the day it is important whether you make money or not. In my opinion it doesn’t hurt to be aware of both. If negative data was reported for the USD you can expect the currency to devaluate. Now this is fundamental analysis. At this point moving to technical analysis could help you pinpoint an exact entry and stop loss levels.
I’m sure you all have a great strategy and/or method that you are following but in this post I would like to talk about the Triangle Pattern which I believe is extremely important, profitable, easy to spot and identify, and most of all could be used on literally any financial instrument and time frame combination you wish.
Triangles could be used on their own or in conjunction/addition to other strategies. Whichever you decide to do, i’m sure you will find the explanations and examples below extremely helpful. Let’s start with the essence.
Types of Triangles
There are 3 types of triangles we identify in the markets – Ascending, Descending and Symmetrical.
Let’s start with Symmetrical. You will notice that each leg is shorter than the previous one.
Symmetrical Traingle
Bullish Symmetrical Triangle
Bearish Symmetrical Triangle
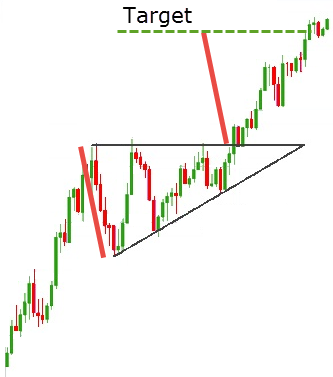
Here is live chart example:
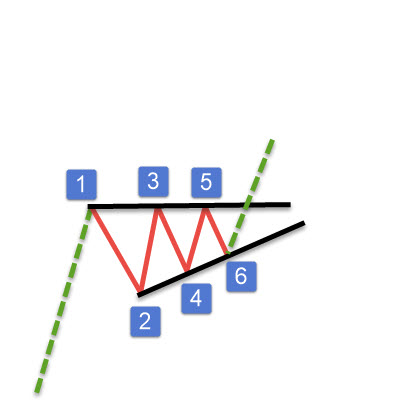
You want to trade the symmetrical triangle after the sixth spot inside has been created (six touch). Using the examples above here is how the count should look like:
And of course vice versa for the bearish one:
Entry
Bullish – once the high of point 5 is broken up enter buy
Bearish – once the low of point 5 is broken down enter sell
Stop Loss
Bullish – below the low of point 6 (aggressive) or point 4 ( conservative)
Bearish – above the high of point 6 (aggressive) or point 4 ( conservative)
Targets
The target is simple projection of the width of the triangle. You would basically measure the distance between points 1 and 2 and project it after the break. Here is how it looks like:
Now let’s go over the next type of triangles – Ascending.
Ascending Triangle
It looks pretty much like the symmetrical triangle but the only difference is that on one side the price will create a horizontal line. When found in a bullish trend, a further continuation up is expected.
Bullish Ascending Triangle – Top Trend Line is horizontal
Entry
After the 6th touch, look for a breakout above the trend line created by connecting points 1,3 and 5.
Stop Loss
Below the low of point 6 (aggressive) or point 4 ( conservative).
Targets
Duplicate the distance between points 1 and 2 (like in symmetrical triangles)
Example:
TIP: if you find ascending triangle at the end of a bearish trend, you can expect a trend reversal. Trade it according to the same rules but as reversal pattern, not continuation.
And now the last one…
Descending Triangle
Descending triangles are usually continuation patterns, when found in a bearish trend. They look exactly the same as the Ascending triangles, as the only difference is that the formation is upside down. The horizontal line is on the bottom instead of the top.
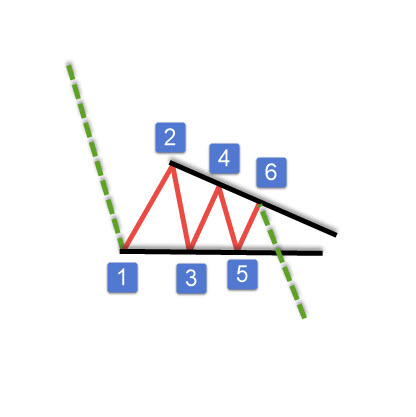
Entry
Look for a breakout below the trend line created by connecting points 1,3 and 5.
Stop Loss
Above the high of point 6 (aggressive) or point 4 ( conservative).
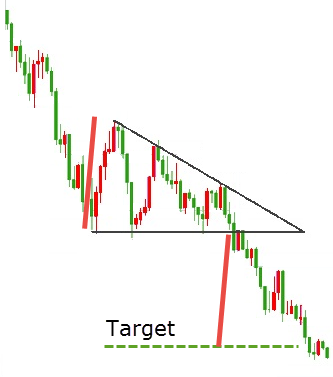
Targets
Duplicate the distance between points 1 and 2 (like in symmetrical triangles) and project it from the breakout.
TIP – If you find descending triangle at the end of a bullish trend, you can trade it as a reversal pattern.
Example:
Statistics
There are research studies where it was proven that triangles have a very descent win rate of over 70%. In other words, your target will be reached 7 out of 10 times when you are trading a triangle pattern. I consider this very high especially when you include an additional filter to take trades that have at least 1:1,5 risk:reward ratio ( potential risk $1, potential reward $1.5).
Why Triangles?
There are numerous reasons why traders around the globe love trading these patterns:
* Extremely easy to identify
* No additional strategies or knowledge is required to trade them
* High success rate
* Perfect as additional tool to implement into your trading strategy
* Applicable to any time frame
* Applicable to any financial instrument
That covers it all for the three types of triangles. Stay tuned for more trading patterns that will help you tremendously in your trading!
If you like this article please do share it and like it. I would love to hear your comments and inputs below.
Have a great remaining of the weekend!
Yours,
Vladimir


