



The financial markets are entering another potentially volatile week, with several interesting technical developments creating opportunities across Forex, gold, and stock indices.
Should you sell EUR/USD before preparing for a potential bullish reversal? Is GBP/JPY ready for another major bearish move from its key resistance zone? Could gold recover toward 4,200 before sellers regain control? And is the S&P 500 preparing for another significant decline toward 7,000 and potentially 6,400?
There are several important technical structures developing, and understanding what happens around these key areas could make a significant difference to our trading decisions this week.
In this week’s Forex forecast, I will analyze four major markets, explain the technical signals I am watching, and share the trading scenarios I believe could offer interesting opportunities.
- 1 Trade with AvaTrade and Unlock Unlimited Home Trader Club Access
- 2 Watch the Full Weekly Forecast Video
- 3 1. EUR/USD Forecast: One More Drop Before the Next Buying Opportunity?
- 4 2. GBP/JPY Forecast: A Powerful Resistance Zone for the Next Sell Opportunity
- 5 3. Gold Forecast: Short-Term Buy Opportunity, Longer-Term Bearish Outlook
- 6 4. S&P 500 Forecast: Is Another Major Sell-Off Coming?
- 7 Final Thoughts: What Is the Best Trading Opportunity This Week?
Trade with AvaTrade and Unlock Unlimited Home Trader Club Access
We have partnered with AvaTrade, one of the industry’s leading regulated brokers.
When you open and trade with AvaTrade through our partnership, you receive:
- Unlimited access to Home Trader Club
- Real-time trading education
- Daily and swing trading opportunities
- Our complete educational library
- Access to our Trade Copier Project
- Members-only trading community
If you’re looking to accelerate your trading journey while enjoying premium education, this partnership gives you everything you need under one roof.
If you already have account with them, still follow this link to open separate account with separate email. Once you did that, contact me with the telegram link below and we will give you the access.
 Watch the Full Weekly Forecast Video
Let’s take a look at the charts!
1. EUR/USD Forecast: One More Drop Before the Next Buying Opportunity?
Trading Bias: Short-Term Bearish – Preparing for a Potential Bullish Reversal
Let’s start with EUR/USD.
In our previous weekly forecast, we discussed the possibility of one final bearish move before buyers potentially regain control.
My view has not changed.
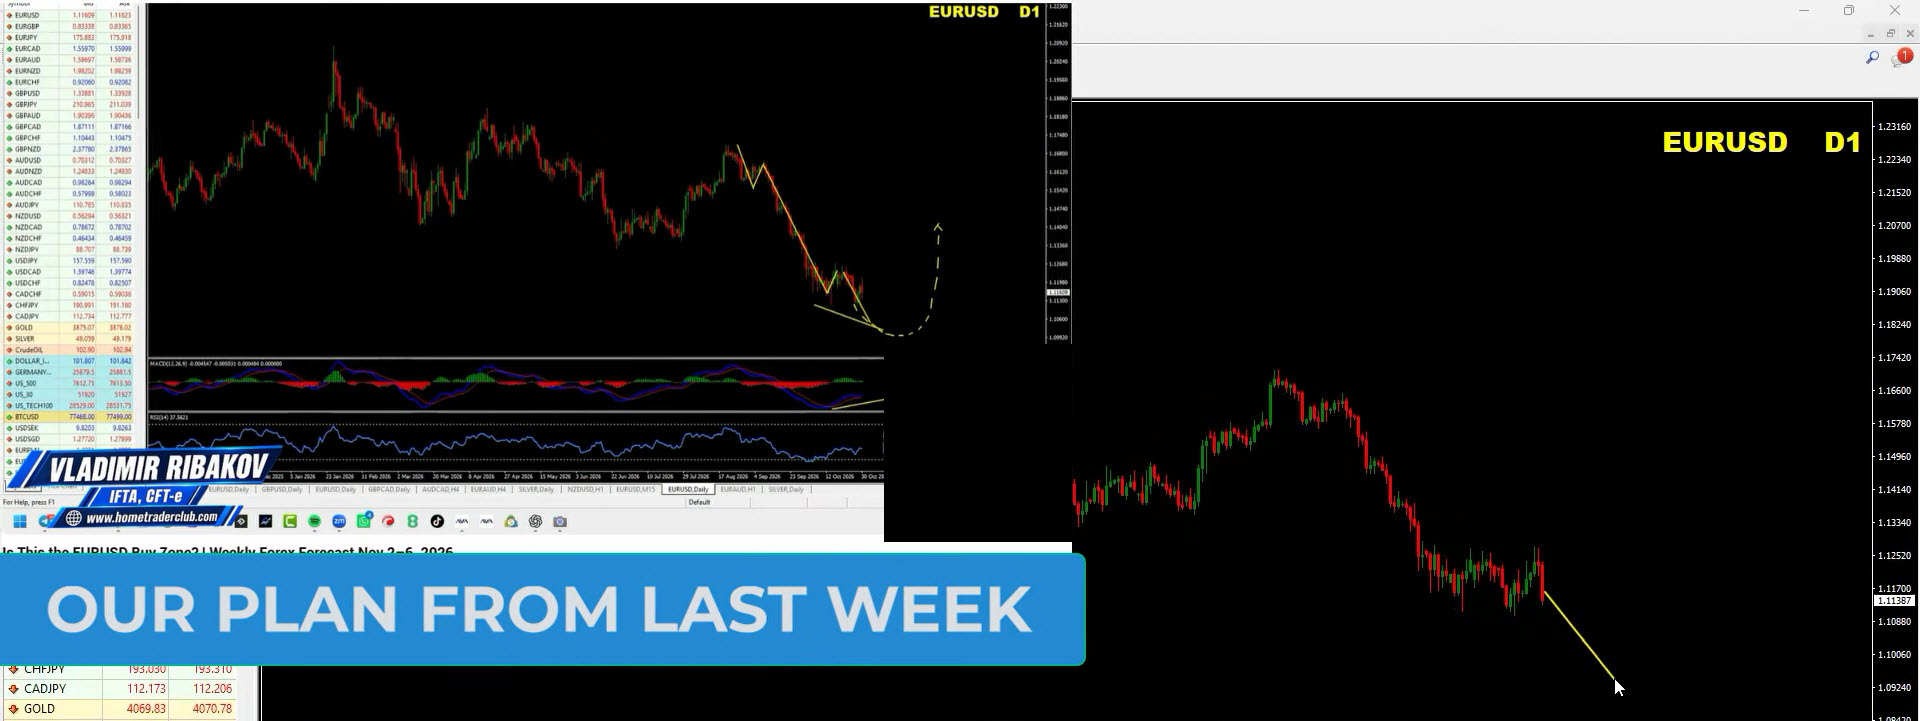
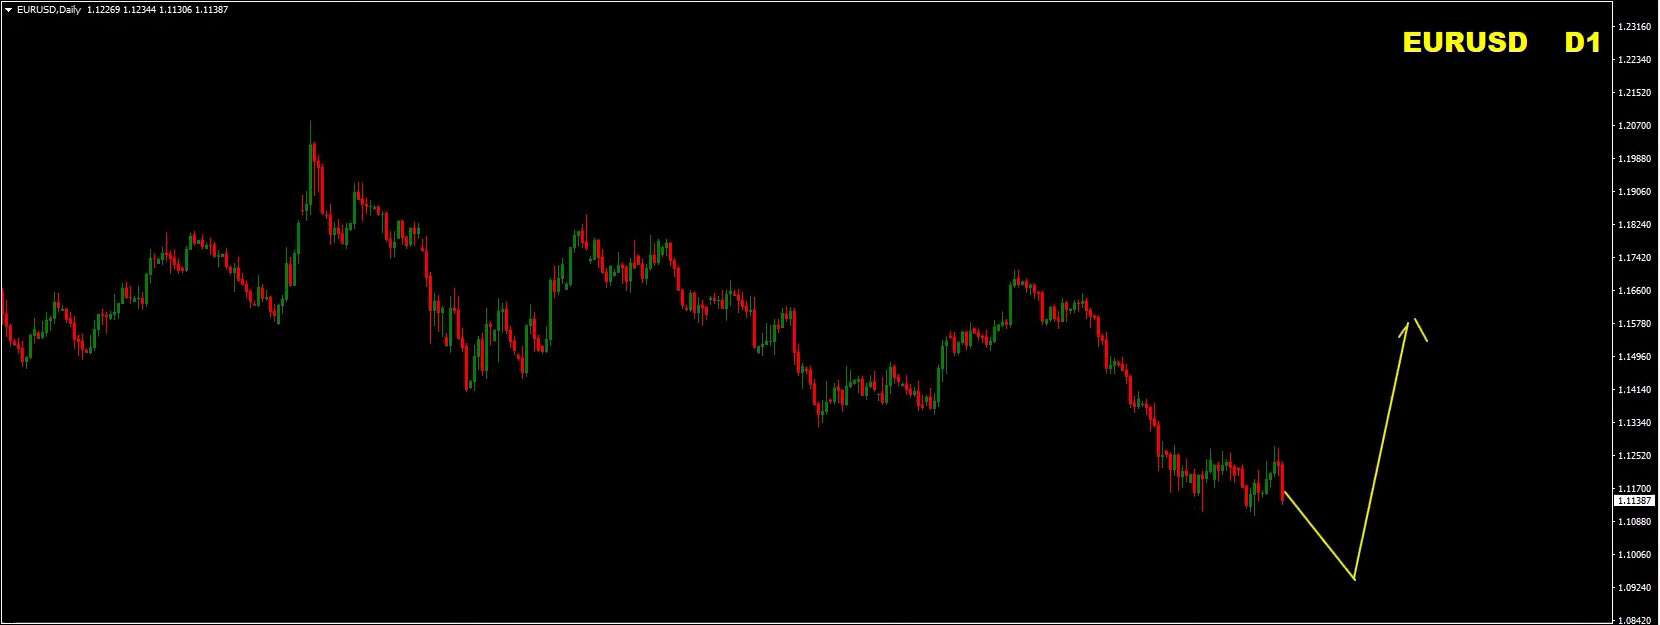
I still believe EUR/USD could make another move toward the downside before a more meaningful bullish recovery begins.
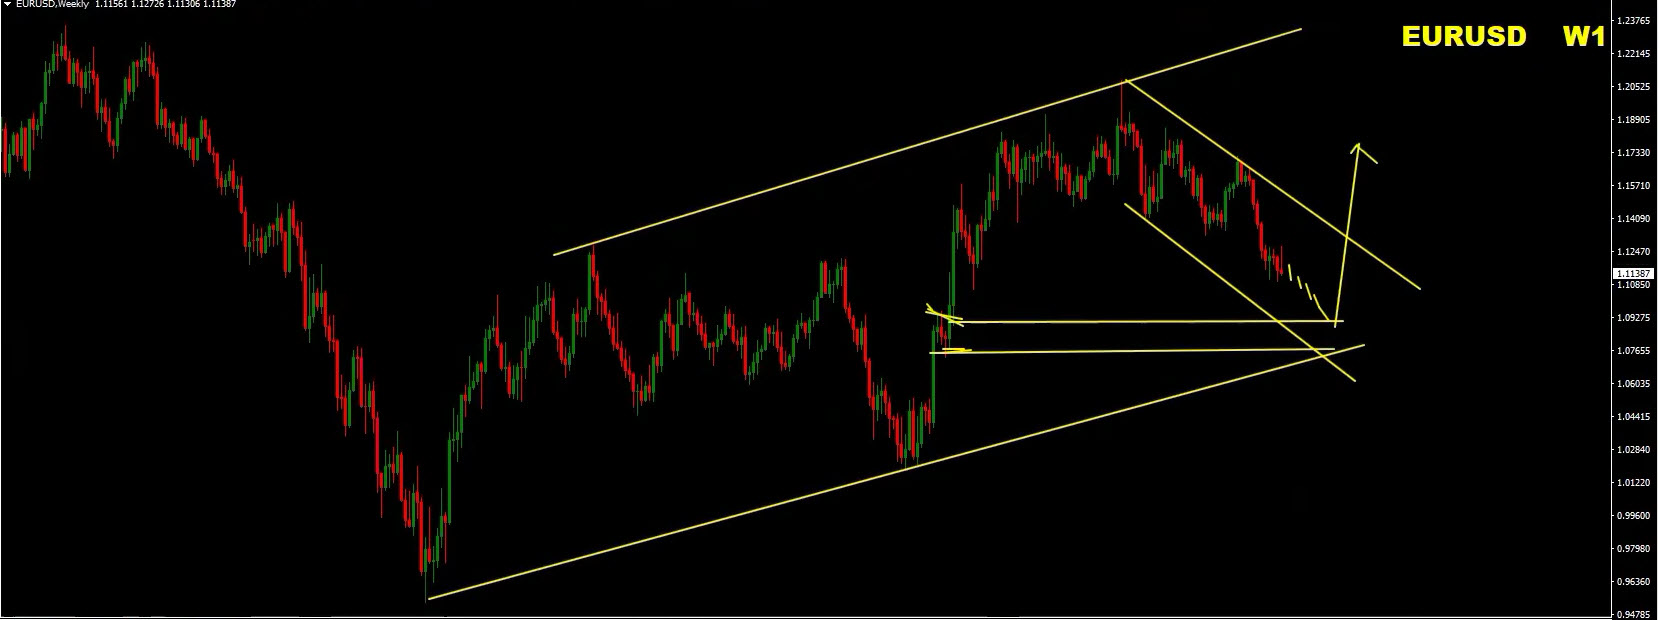
The reason is quite simple. The market is moving within a larger rising channel, and inside that structure, we can identify another smaller channel.
This smaller channel is particularly important because the market often revisits these internal structural areas before producing a meaningful reaction in the opposite direction.
Why Am I Expecting Another Move Lower?
The current price structure suggests that EUR/USD may not have completed its bearish movement yet.
There is an interesting technical zone around the lower part of the internal channel that I would like to see price retest.
This area could provide the final liquidity sweep before the market starts forming a more meaningful bottom.
However, I am not interested in selling blindly.
There is one important technical signal I am watching very closely: bullish divergence.
EUR/USD: Watch for Bullish Divergence
On the daily chart, we are approaching a potentially interesting situation.
If EUR/USD makes another lower low, I want to see whether MACD and RSI confirm that move or start showing signs of weakening momentum.
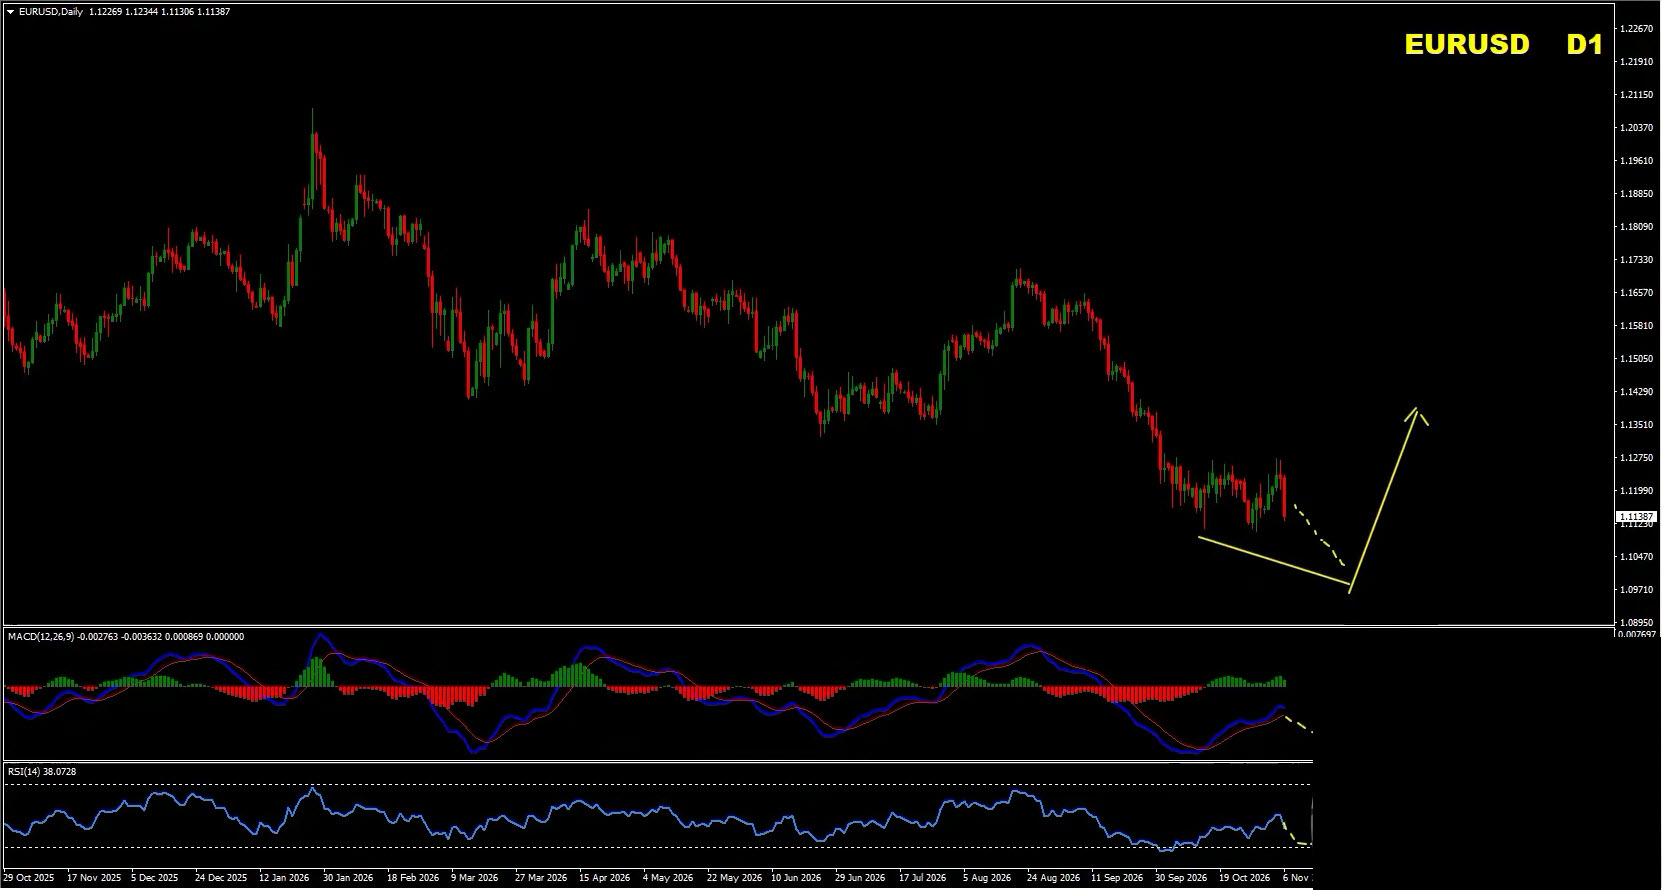
A bullish divergence develops when:
- Price creates lower lows.
- MACD creates higher lows.
- RSI also starts turning upward.
- Selling momentum begins to weaken.
If these conditions develop around the important channel support area, it could indicate that the current bearish move is approaching exhaustion.
The important point is that I want the divergence to develop around a meaningful technical zone, rather than treating every divergence signal as a trading opportunity.
My EUR/USD view: I still expect one more bearish move before the next major buying opportunity. However, traders should start preparing for a potential bullish reversal rather than becoming overly bearish at this stage.
The key is to be patient and wait for confirmation.
2. GBP/JPY Forecast: A Powerful Resistance Zone for the Next Sell Opportunity
Trading Bias: Bearish – Looking to Sell the Rallies
GBP/JPY is another market offering an interesting technical setup.
Last week, we identified an important resistance and supply area and discussed looking for selling opportunities from that zone.
The market respected the area and moved lower.
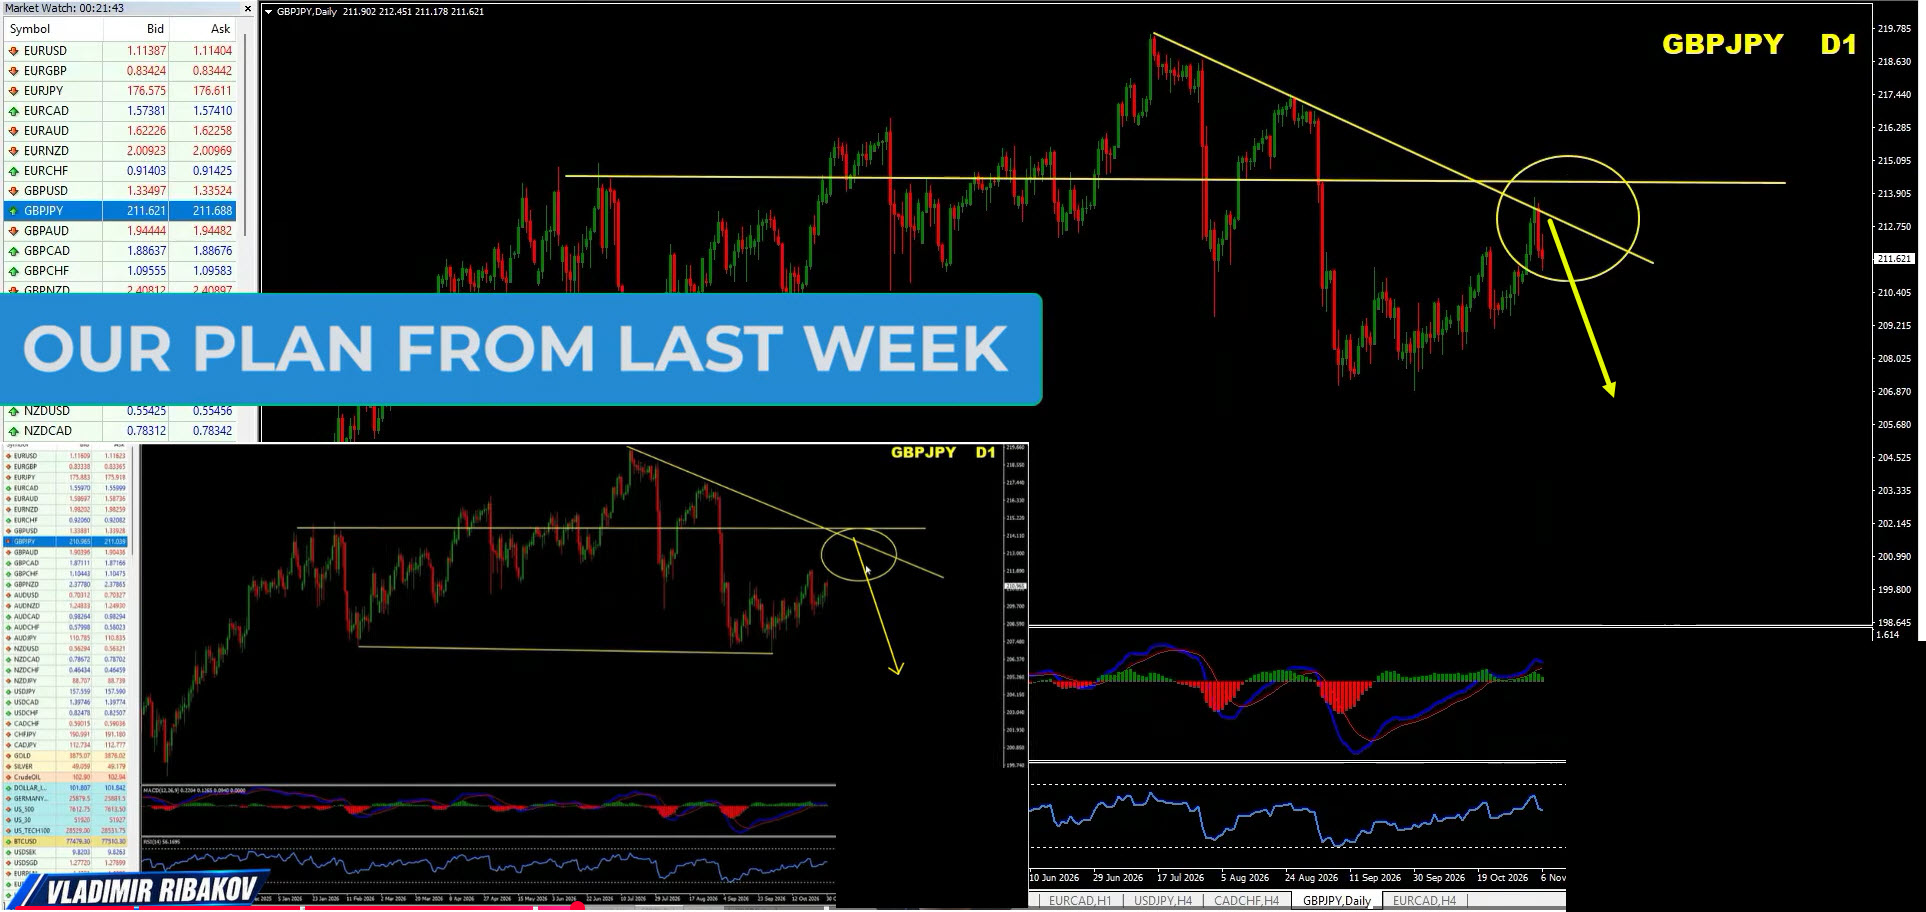
Now the question is: what happens next?
I believe GBP/JPY has two possible scenarios, but regardless of which one develops, my preferred trading direction remains bearish.
GBP/JPY: The Importance of the Internal Channel
One of the interesting things about the current GBP/JPY structure is that we are seeing a channel developing inside a larger channel.
This gives us two possible ways the market could continue.
The first scenario is relatively straightforward.
If GBP/JPY manages to break below the internal channel, that could open the door for another bearish move.
A confirmed breakdown would suggest that sellers are regaining control and that the existing bearish momentum could continue.
However, there is another possibility worth considering.
Two Possible GBP/JPY Trading Scenarios
Scenario 1: Internal Channel Breakdown
This is the more straightforward bearish scenario.
If price breaks below the internal channel and confirms the breakdown, we could see the market accelerate toward the downside.
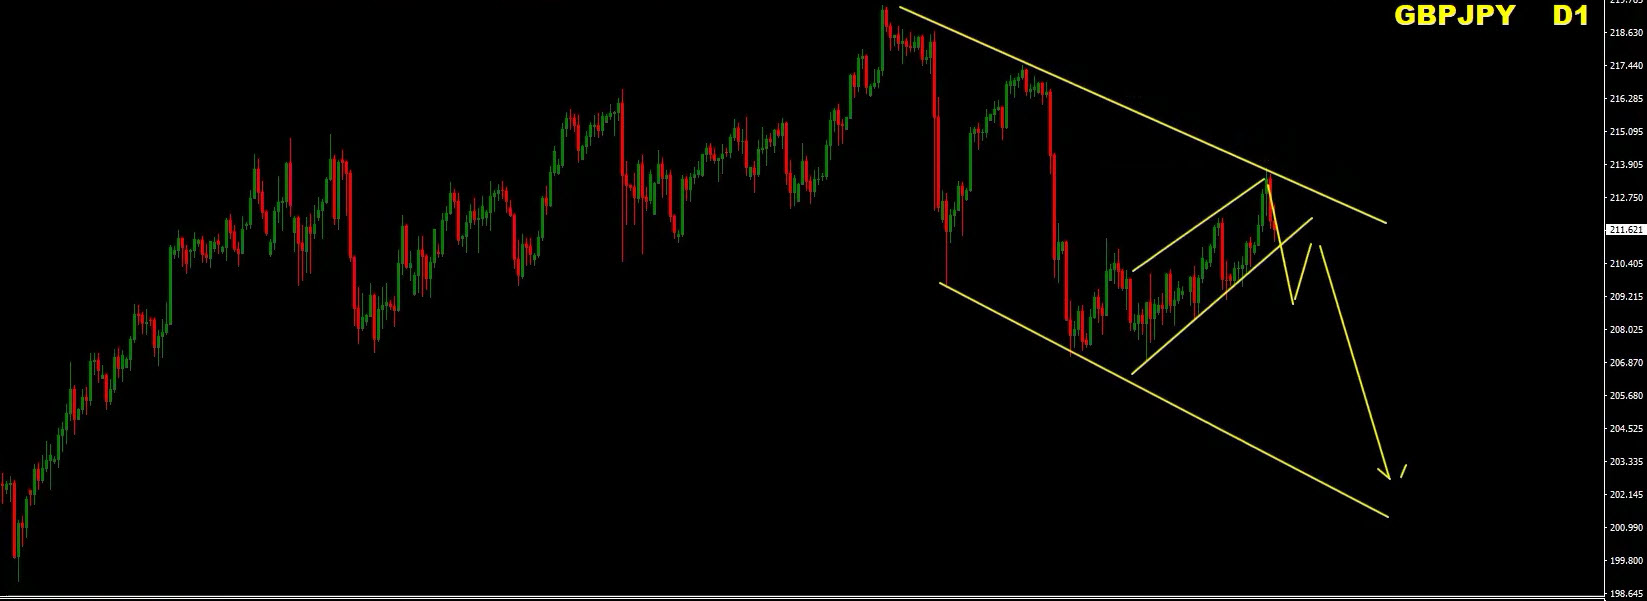
In this case, I would look for potential selling opportunities following a corrective retest of the broken structure.
Scenario 2: One More Corrective Rally Before the Sell-Off
This is a slightly more complex scenario, but it is important.
The recent upward movement developed through three higher highs and higher lows.
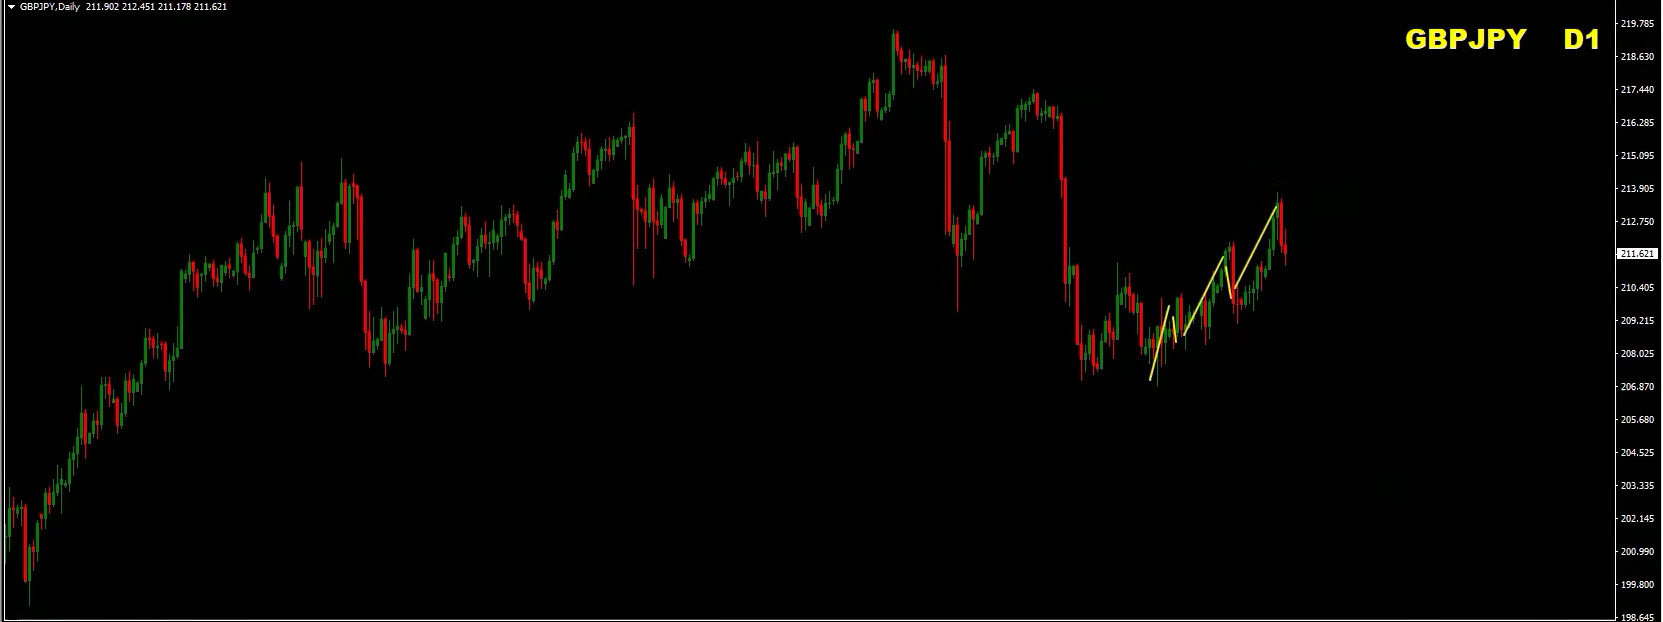
In certain situations, this type of corrective structure can lead to one final downward move, followed by another upward correction.
If that happens, GBP/JPY could produce another rally toward the resistance area.
I would then watch for bearish divergence, particularly lower highs on MACD or RSI while price attempts to push higher.
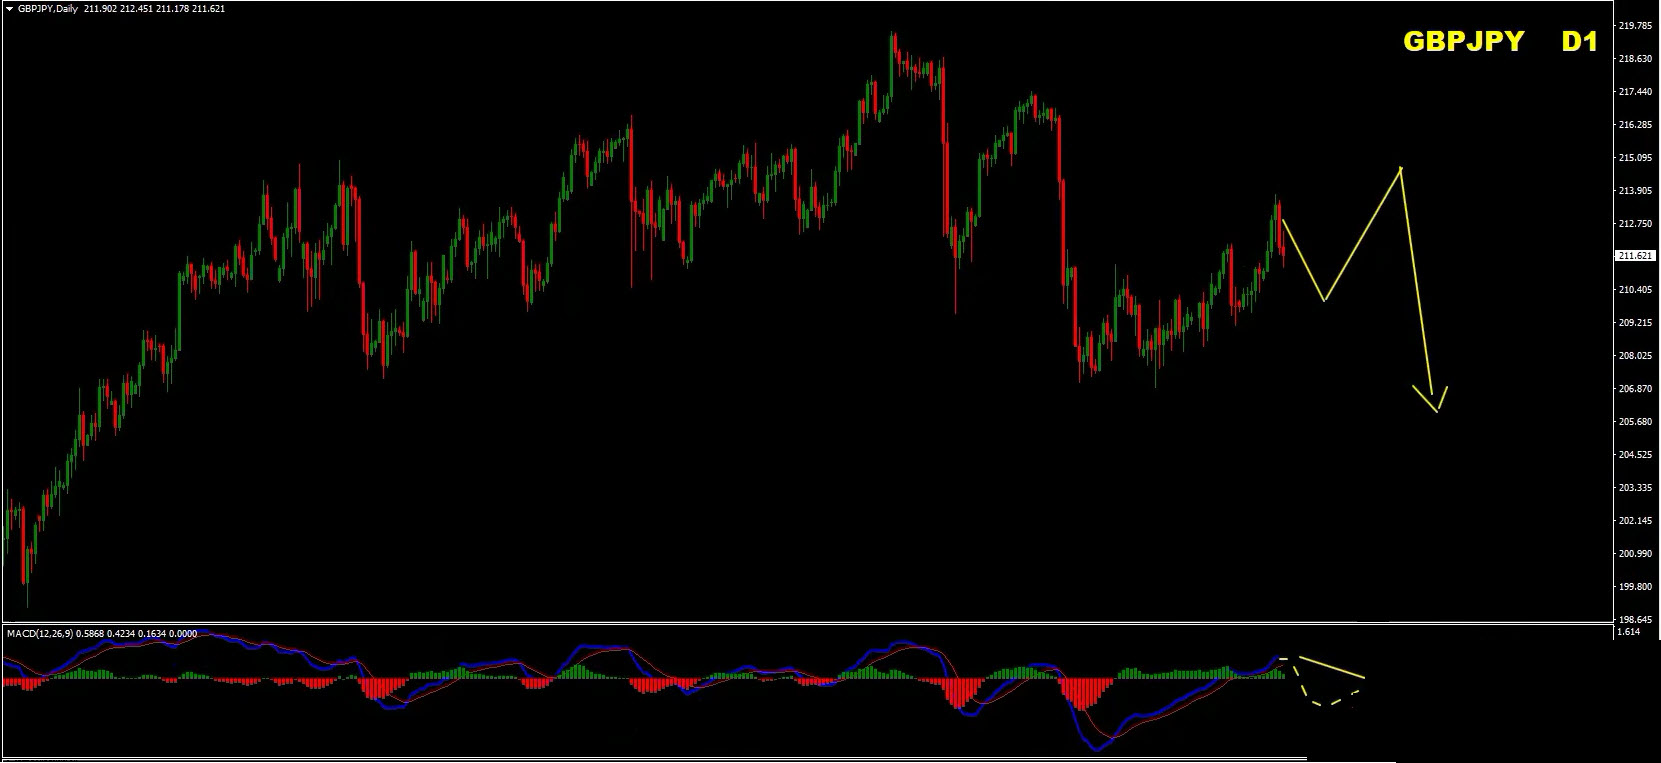
If the divergence develops and price confirms a bearish reversal, that could provide an excellent opportunity to look for selling positions.
GBP/JPY Trading Plan
My preference is to sell GBP/JPY rather than buy it.
I will be monitoring the internal channel, the resistance area, and the lower-timeframe price structure.
Whether the market breaks down immediately or completes another corrective rally first, I am interested in identifying the next high-quality selling opportunity.
My GBP/JPY view: Sell the rallies. The important resistance zone remains the area where I want to see sellers regain control.
3. Gold Forecast: Short-Term Buy Opportunity, Longer-Term Bearish Outlook
Trading Bias: Short-Term Bullish – Longer-Term Bearish
Gold is probably the trickiest market in this week’s analysis.
There are conflicting technical signals across the higher and lower timeframes, and this is exactly why I want to approach the market carefully.
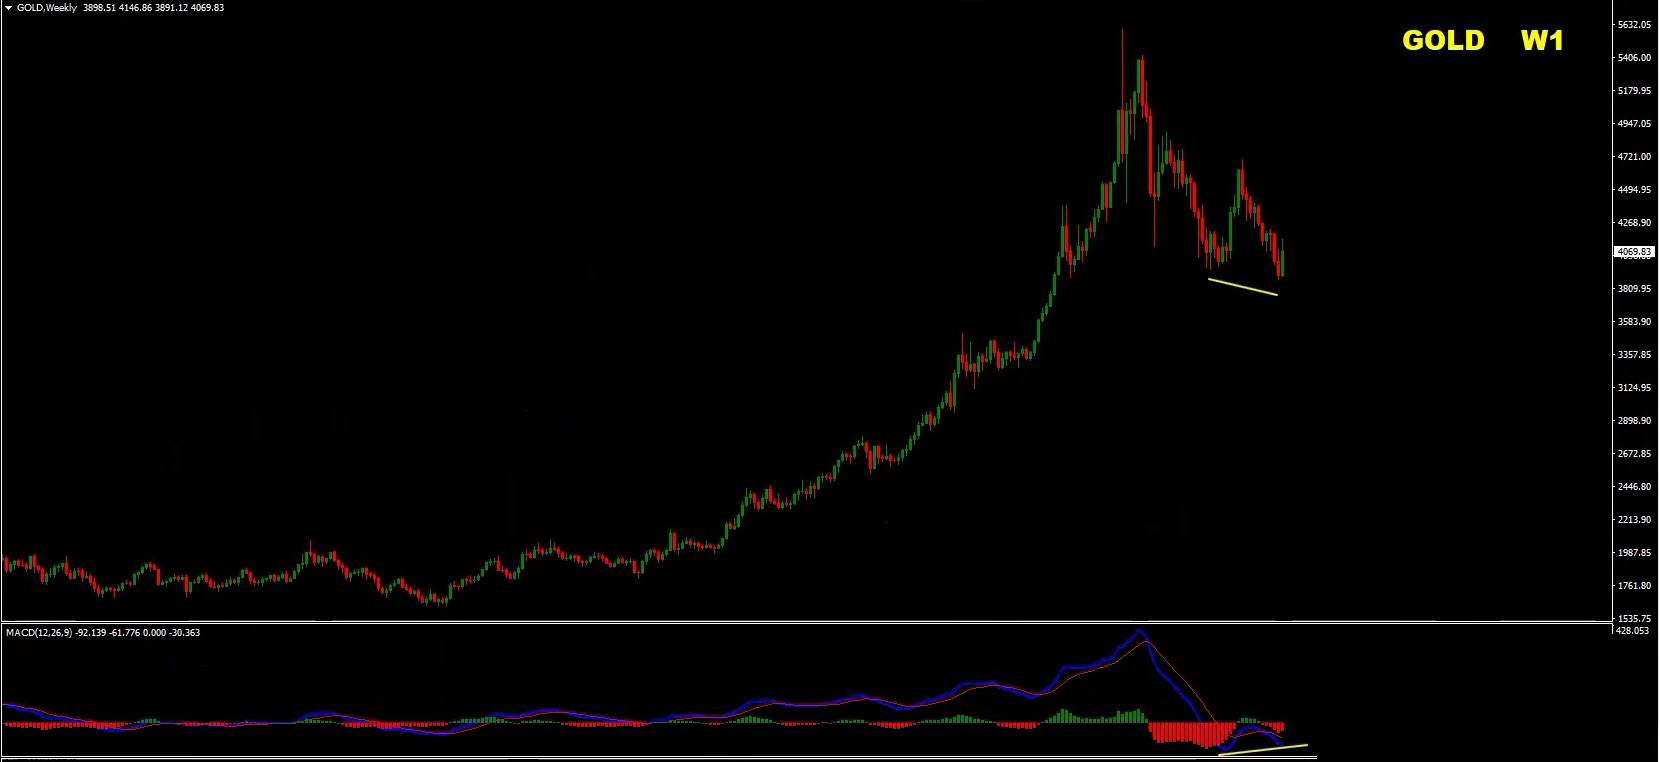
On the weekly chart, we already have a bullish divergence developing,
accompanied by a bullish engulfing candlestick formation.
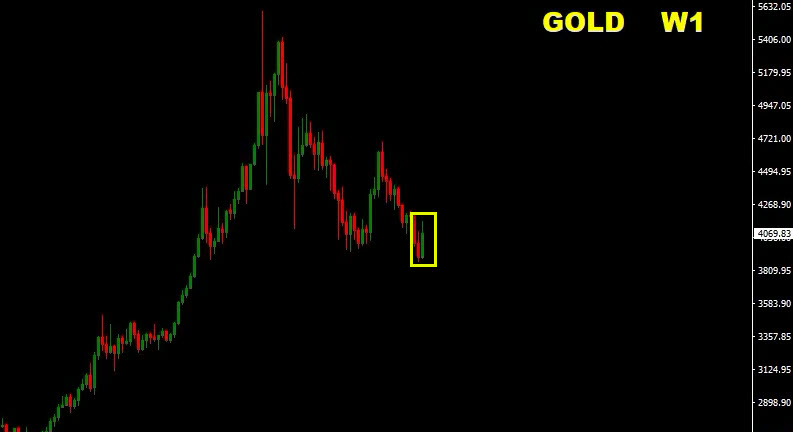
These are interesting signs that gold could be preparing for a recovery.
However, there is one important problem.
The daily chart has not fully aligned with the weekly structure.
Gold Weekly Chart: Bullish Divergence and Engulfing Pattern
The weekly chart is showing a bullish divergence.
This means price has been forming lower lows while the momentum indicator has been showing higher lows.
We also have a bullish engulfing formation, which adds further interest to the possibility of a recovery.
Normally, I prefer to see the weekly and daily charts supporting the same directional idea.
When both timeframes develop bullish divergence around important support, the probability of a more meaningful reversal can improve.
However, that confirmation is not fully present yet.
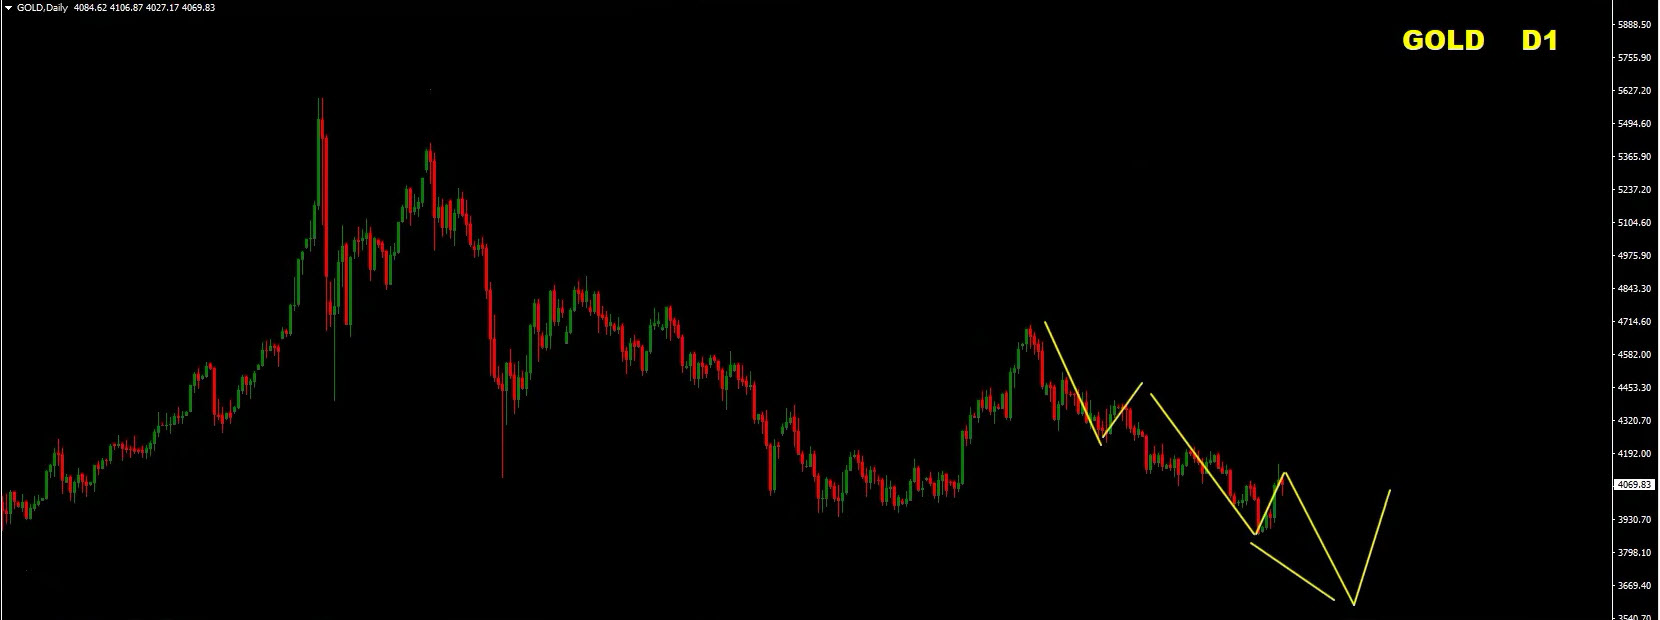
This is why I am not ready to declare that the longer-term bearish move in gold is over.
Gold Four-Hour Chart: A More Interesting Short-Term Setup
Now let’s move to the four-hour chart.
This is where things become particularly interesting.
Between the two important lows, we can identify a clear bullish divergence.
Price created lower lows, while MACD formed higher lows.
That is a classical bullish divergence condition.
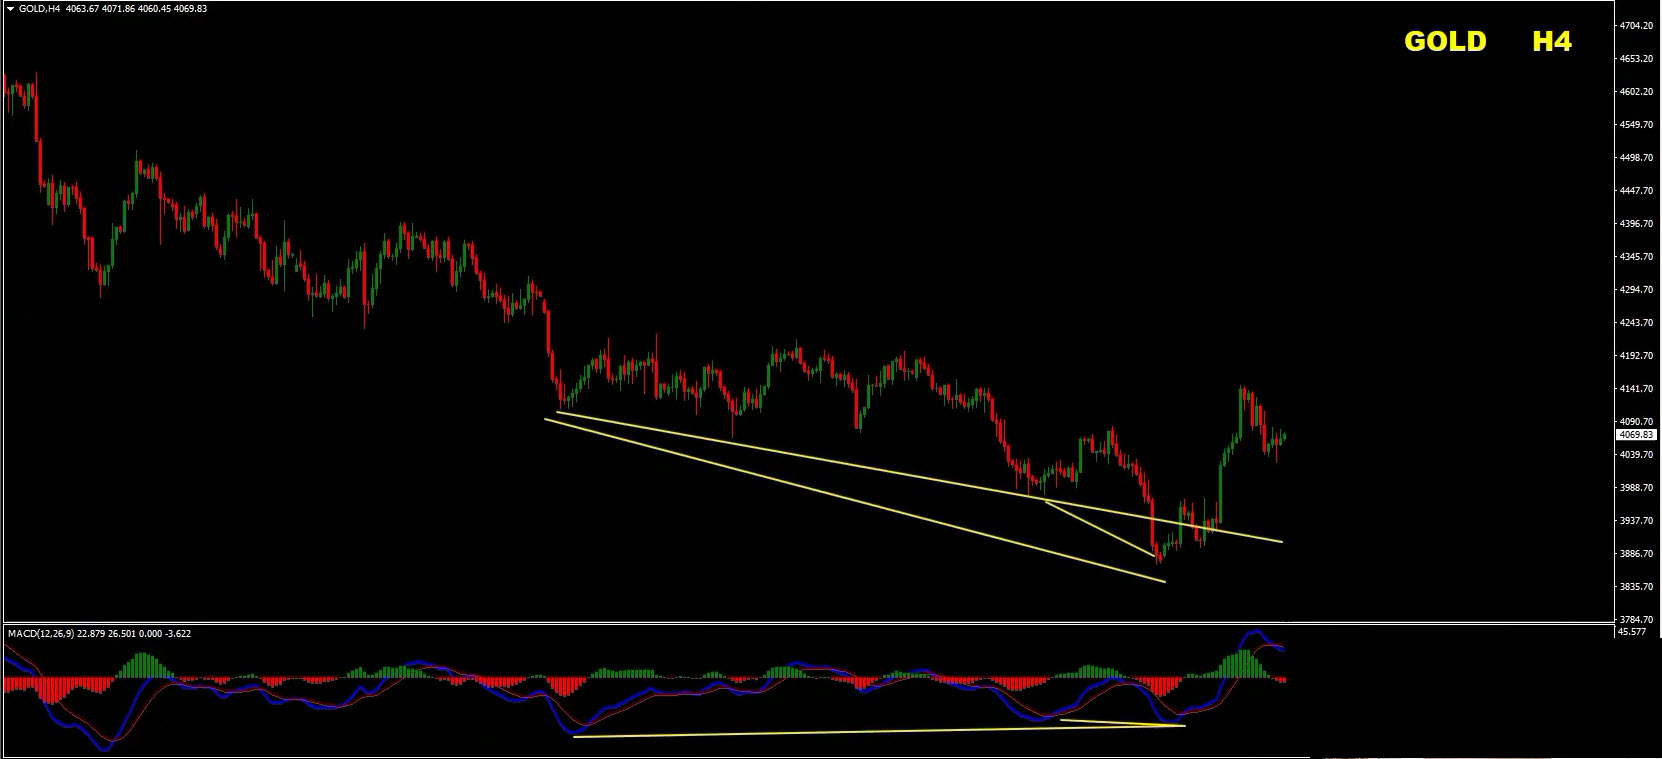
There was also an interesting development between the subsequent lows.
Instead of a confirmed divergence, we saw what I refer to as a fake convergence.
Following that development, price and MACD started forming higher highs.
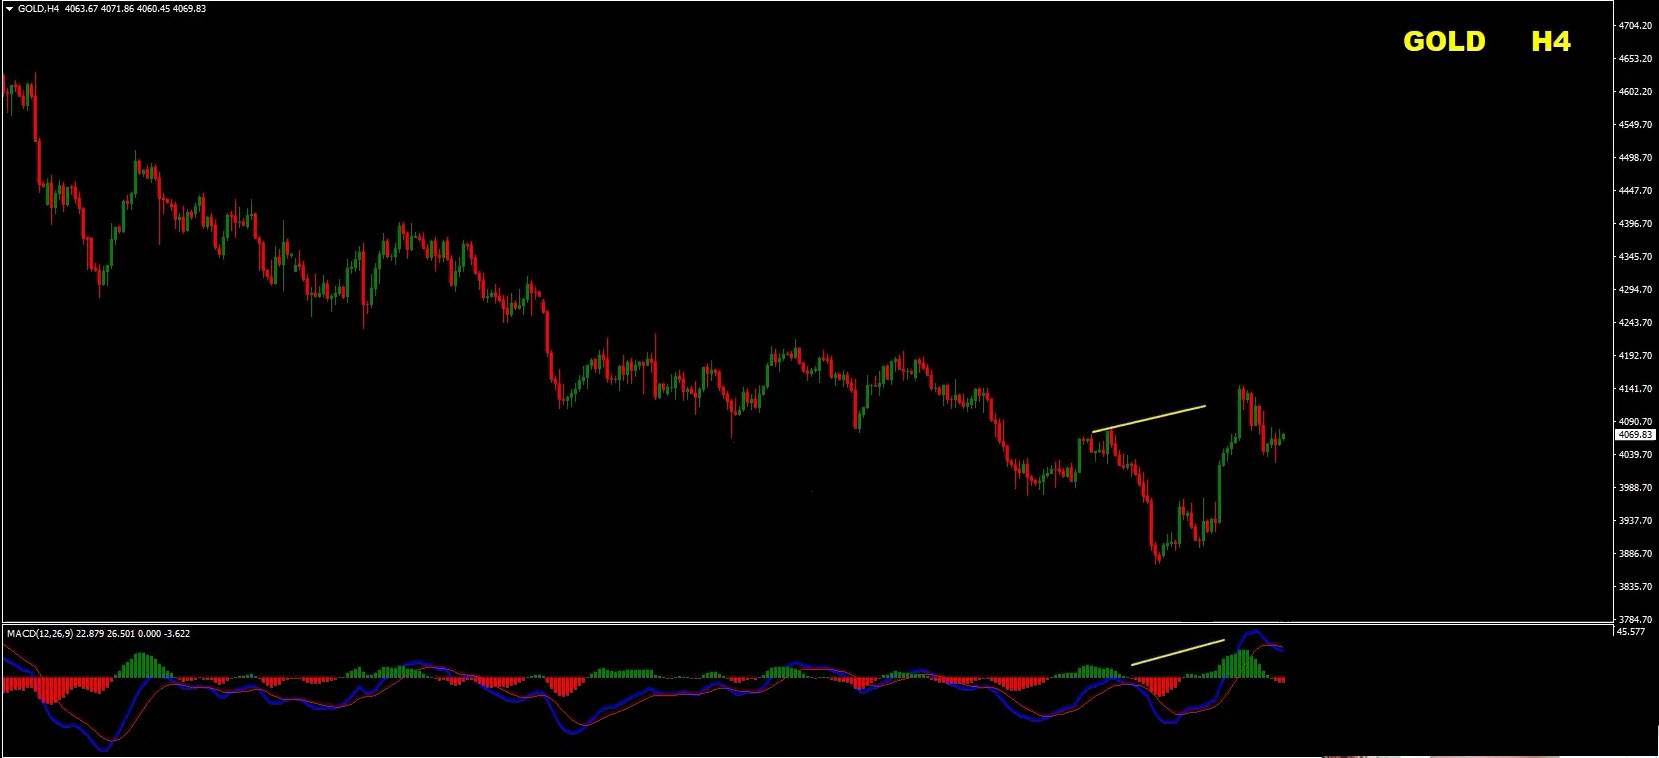
This is an encouraging short-term sign because it suggests that buyers are beginning to regain control.
Key Gold Support Zone: 3,990–3,895
The most important condition for my short-term bullish scenario is that the two highlighted support lows continue to hold.
The approximate support area I am watching is between 3,990 and 3,895.
As long as this zone remains intact, I believe gold has the potential to recover toward the 4,200 region.
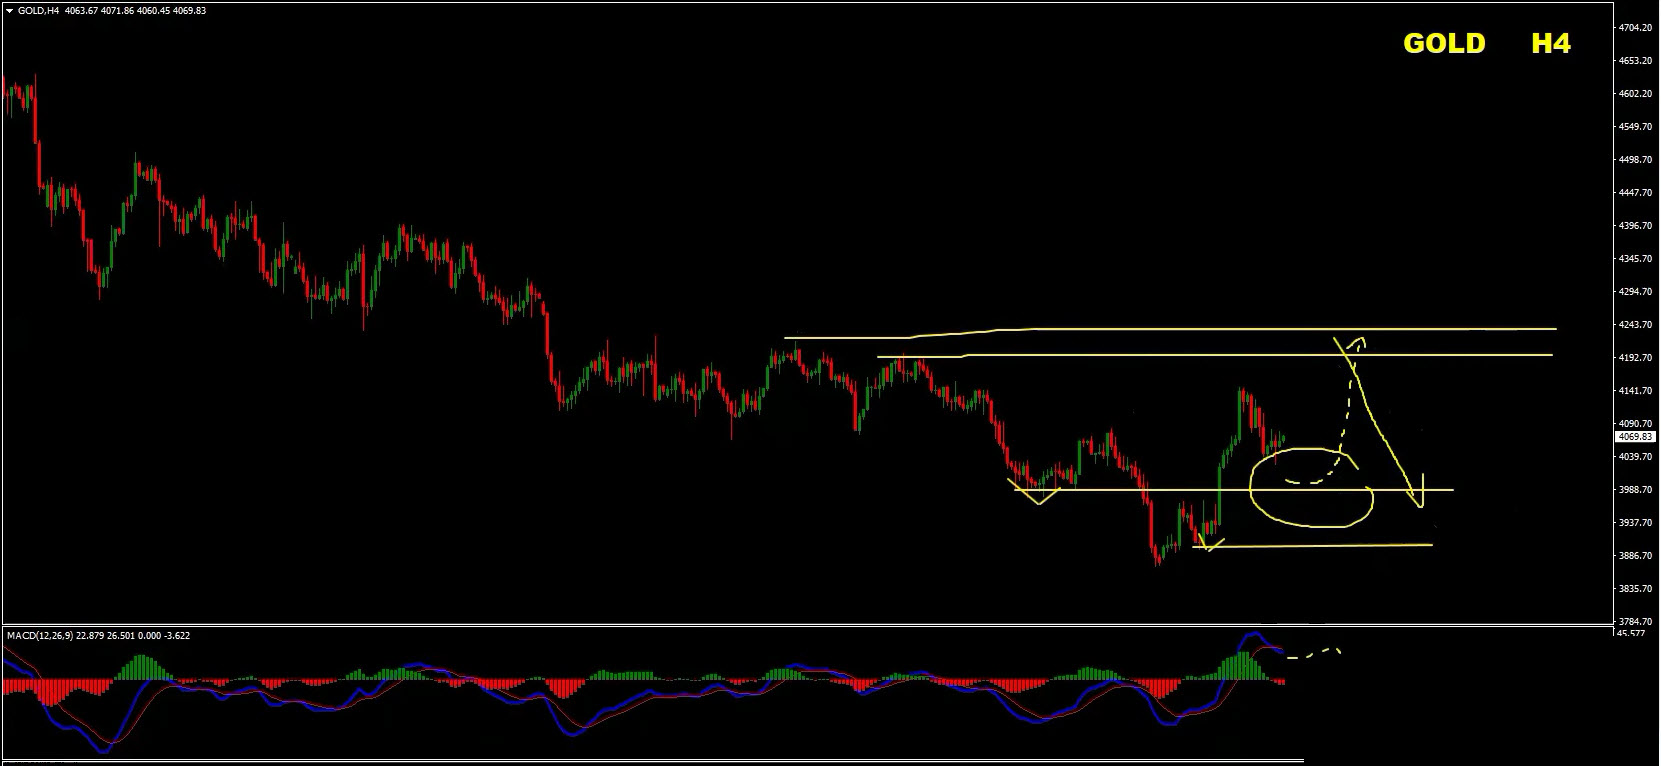
This is where I would start paying close attention again.
Why?
Because the recovery toward 4,200 could eventually create another opportunity for sellers to regain control.
My Gold view: Short-term, I am looking for buys while the 3,990–3,895 support zone holds. Longer-term, I remain bearish and will be watching the 4,200 area for potential selling opportunities if bearish confirmation develops.
This is a double-sided opportunity, and timing will be extremely important.
4. S&P 500 Forecast: Is Another Major Sell-Off Coming?
Trading Bias: Strongly Bearish – Sell the Rallies
Finally, let’s take a look at the S&P 500.
Last week, we discussed the possibility of a significant bearish move toward the important support levels.
And the market delivered.
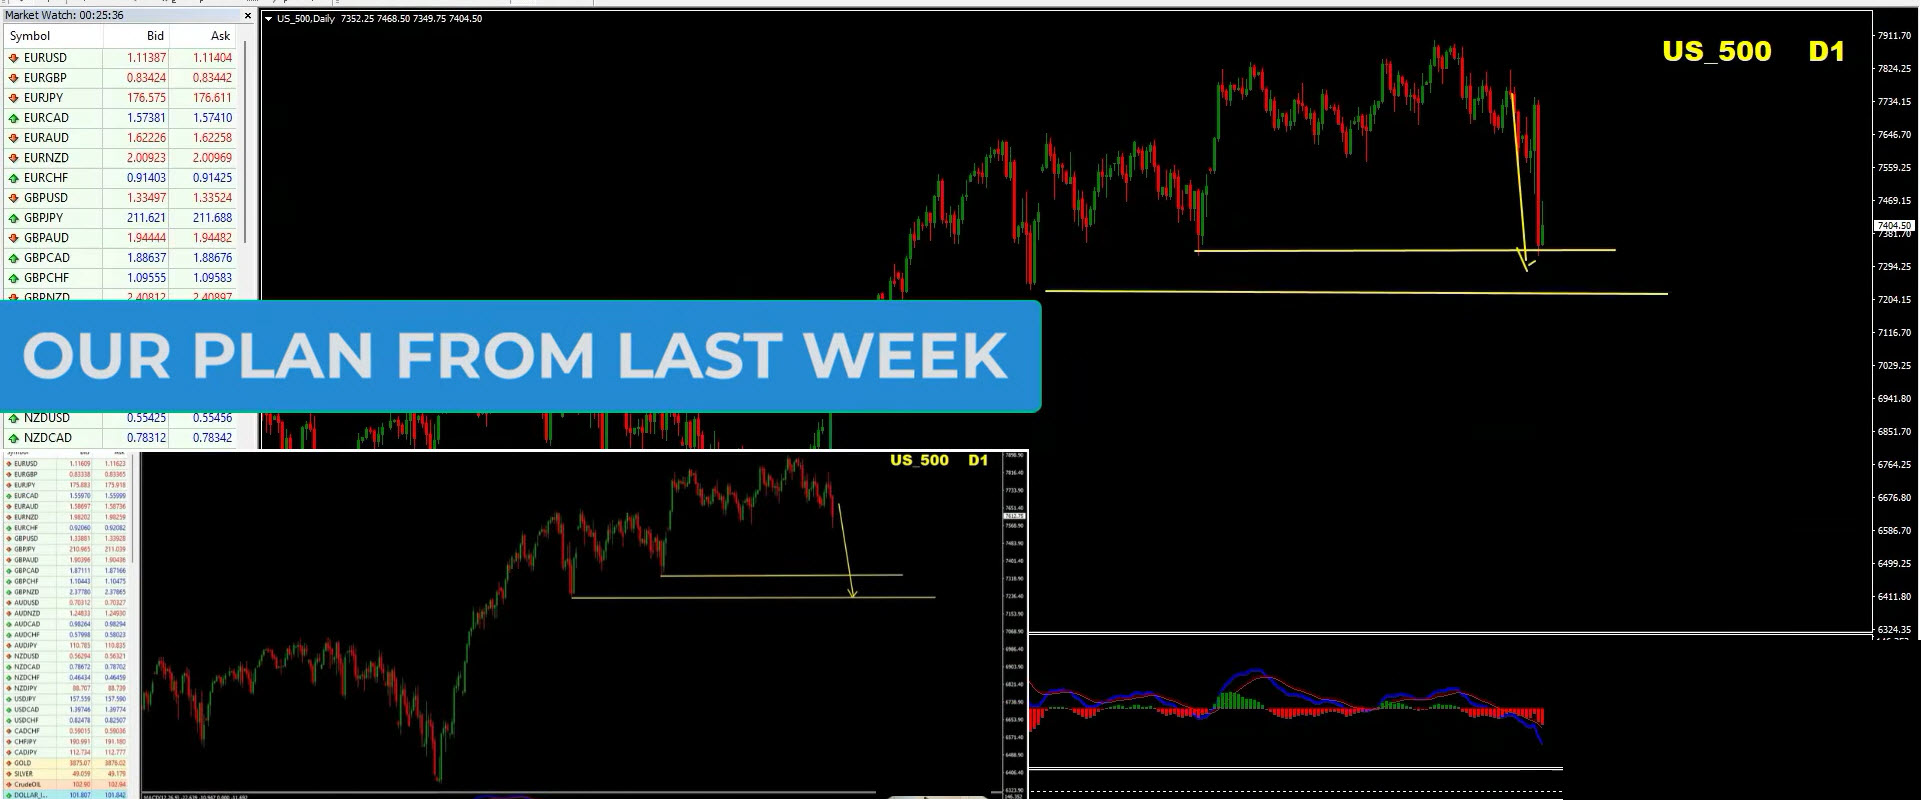
We experienced a highly volatile week, with the S&P 500 moving significantly lower.
Now the biggest question is whether the selling pressure is over.
My answer is no.
I currently do not see convincing technical reasons to become optimistic about the market.
My trading bias remains bearish, and I continue to prefer selling the rallies.
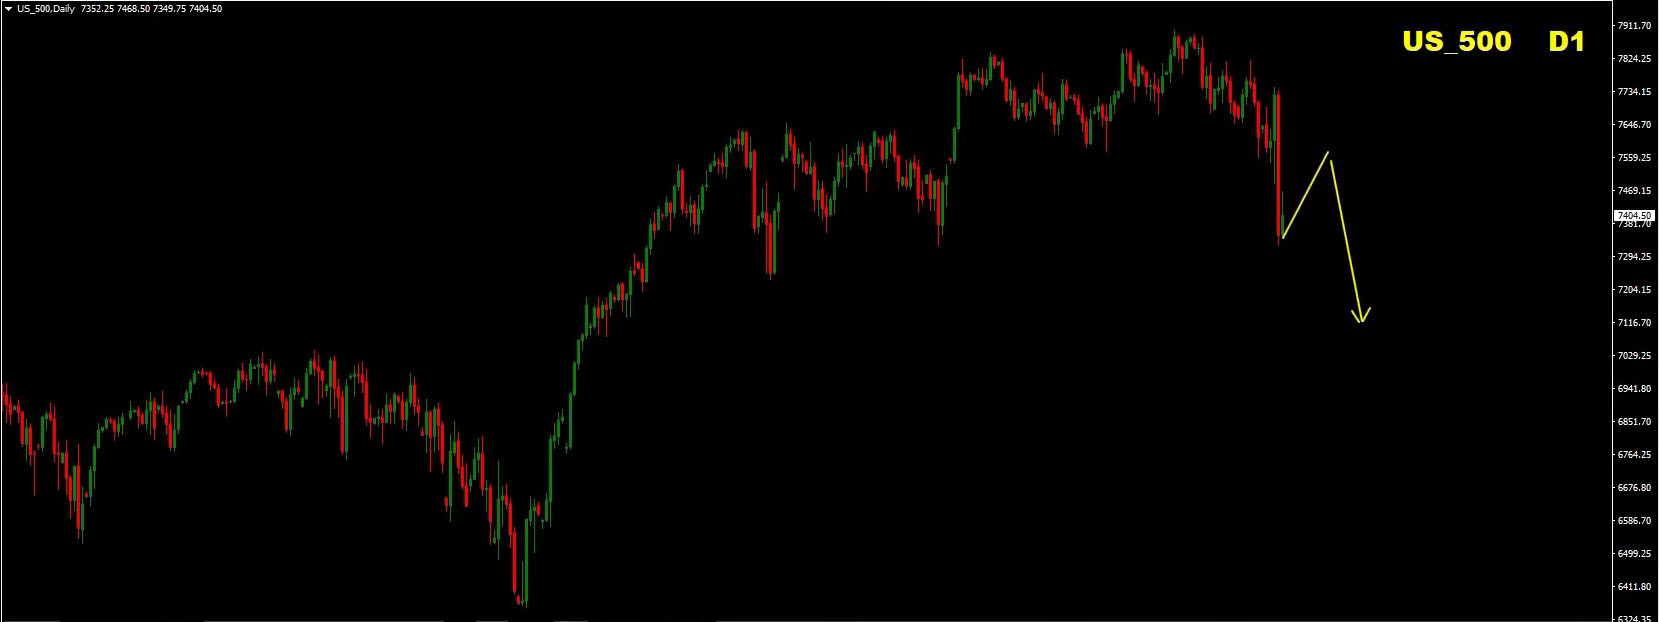
S&P 500 Four-Hour Chart: Key Resistance and Supply Zone
Let’s take a closer look at the four-hour chart.
There are several technical factors coming together around the resistance area.
First, we have a falling resistance line connecting important swing highs.
Second, previously broken support levels are now acting as resistance.
Third, the previous high is creating an important supply area.
When we combine these factors, we get a powerful technical resistance zone.
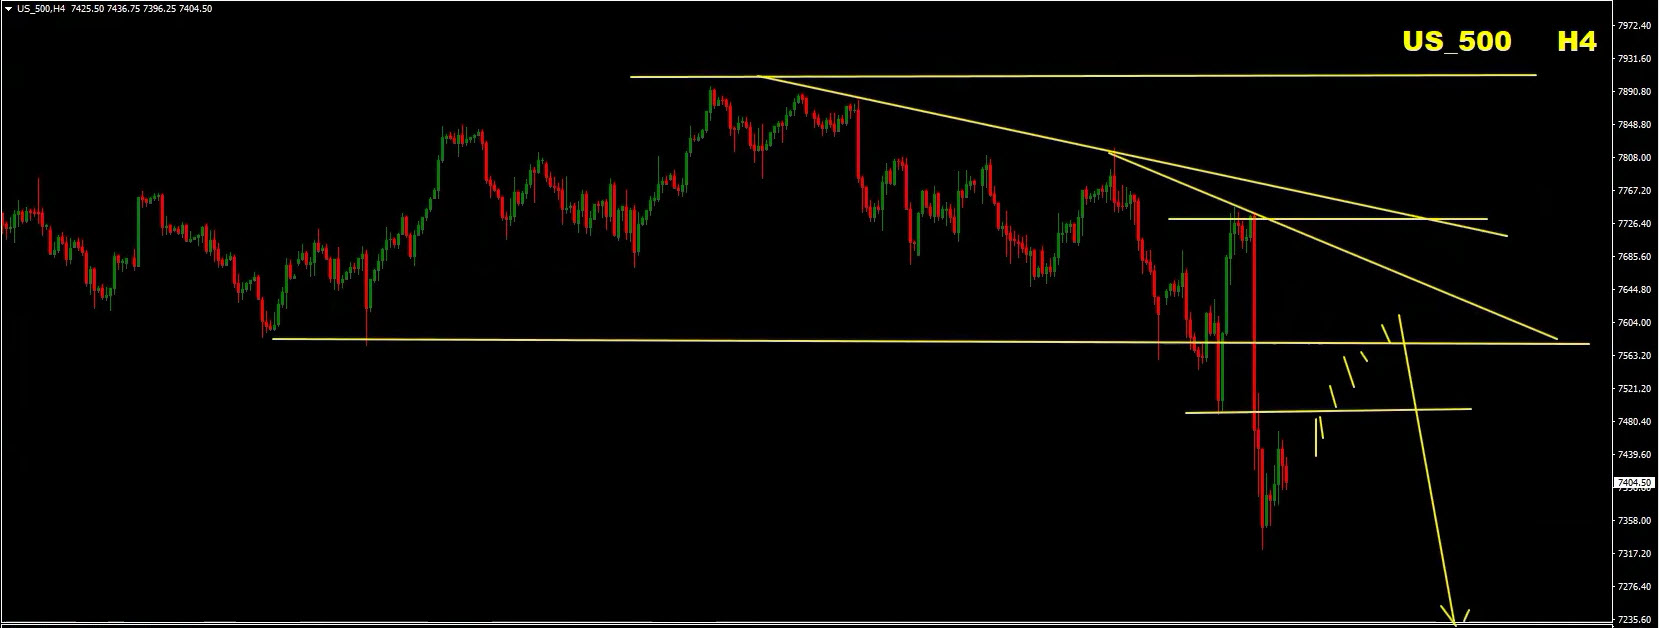
This is exactly the type of area I want to monitor for potential selling opportunities.
Where Am I Looking to Sell the S&P 500?
My preferred scenario is for the S&P 500 to make a corrective recovery toward the resistance and supply zone.
Once price reaches this area, I will be looking for bearish confirmation.
Some of the signals I would like to see include:
- Bearish candlestick reversal patterns.
- Bearish divergence on MACD or RSI.
- Rejection from the falling resistance line.
- Failure to break above the previous supply area.
- A lower high developing on the four-hour chart.
If these conditions develop while the previous swing high remains intact, I believe another bearish wave could follow.
S&P 500 Downside Targets: 7,000 and 6,400
The first important downside area I am watching is around 7,000.
However, I do not believe that this is necessarily the final destination.
If the bearish pressure continues and the market maintains its lower-high and lower-low structure, we could potentially see the S&P 500 extending its decline toward 6,400 or even lower.
These are important downside reference areas in the current bearish cycle.
Of course, price action around each support level will be important, and I will be monitoring how the market reacts before considering further downside opportunities.
S&P 500 Trading Plan
My trading plan remains straightforward.
I am not interested in chasing the market lower after a significant bearish move.
Instead, I want to see a corrective rally toward the resistance area.
From there, I will look for bearish confirmation on the lower timeframes.
As long as the previous swing high holds and the resistance structure remains intact, I will continue looking for selling opportunities.
My S&P 500 view: I remain strongly bearish. The 7,000 region is the next important downside reference, followed by 6,400 or potentially lower if the bearish cycle continues.
For me, this is still a sell-the-rallies market.
Final Thoughts: What Is the Best Trading Opportunity This Week?
This week’s forecast offers some very interesting possibilities.
EUR/USD could be approaching the final stage of its bearish move before buyers regain control.
GBP/JPY continues to offer an attractive bearish structure, with two possible scenarios that could lead to further selling opportunities.
Gold is particularly interesting because the short-term and longer-term outlooks are different. I am looking for buying opportunities while the important support zone holds, but I remain interested in selling the recovery if bearish confirmation develops around 4,200.
The S&P 500 remains my strongest bearish view, and I will continue looking for opportunities to sell the rallies while the important resistance structure holds.
Remember, traders, the goal is not to predict every market movement perfectly.
It is to identify the important technical areas, wait for confirmation, and manage risk properly.
Now I would like to hear from you!
Which of these opportunities do you find the most interesting this week?
Are you preparing to buy EUR/USD after the final drop? Do you agree with my bearish outlook on GBP/JPY? What do you think about gold’s potential recovery toward 4,200? And could the S&P 500 really move toward 6,400?
Share your thoughts and trading ideas in the comments below.
If you enjoyed this weekly market analysis, make sure you hit the like button and subscribe to our channel if you are new.
And of course, I would like to invite you to join our trading family, Home Trader Club.
We offer real-time trading opportunities, comprehensive trading courses, trading education, and a dedicated media zone designed to help traders improve their knowledge and trading skills.
Explore everything we offer here:
https://www.hometraderclub.com
Thank you for watching and reading.
Best to you and yours, and I’ll see you soon with more good trading!
Vladimir Ribakov
Internationally Certified Financial Technician
Home Trader Club
Risk Disclaimer
Trading Forex, CFDs, commodities, indices, and other financial instruments involves significant risk and may not be suitable for every investor. Leverage can magnify both profits and losses. The market analysis, forecasts, and trading scenarios presented in this article are for educational and informational purposes only and do not constitute investment advice or a recommendation to buy or sell any financial instrument.
Always conduct your own research, assess your financial situation, and apply appropriate risk management before entering any trade.