


Hi Traders! GBPCHF forecast update and follow up is here. On June 24th I shared this “Technical Analysis – GBPCHF Forecast” post in our blog. In this post, let’s do a recap of this setup and see how it has developed now. If you would like to learn more about the way we trade and the technical analysis we use then check out the Traders Academy Club. Spoiler alert – free memberships are available!
My Idea
On the H1 chart, the price which is moving higher has created multiple false breaks with a bearish divergence between the first high that has formed at 1.27985 and the second high that has formed at 1.28558 based on the MACD indicator which we may consider as evidences of bearish pressure. If the price moves lower and if we get a valid breakout below the low at 1.28000 we may then consider it as a validation for the bearish view and may expect the price to continue lower further. Alternatively if the price moves higher and if we get a valid breakout above the H4 key resistance zone then this bearish view will be invalidated.

GBPCHF H1(1 Hour) Chart Current Scenario
On the H1 chart, the price action followed my analysis and moved lower as per the plan. The validation for the bearish view which is a valid breakout below the low at 1.28000 happened as I expected it to. In addition to this, we also had a breakout of the most recent uptrend line, we may consider these as facts provided by the market supporting the bearish view. The price then moved lower further and delivered 200+ pips move so far.
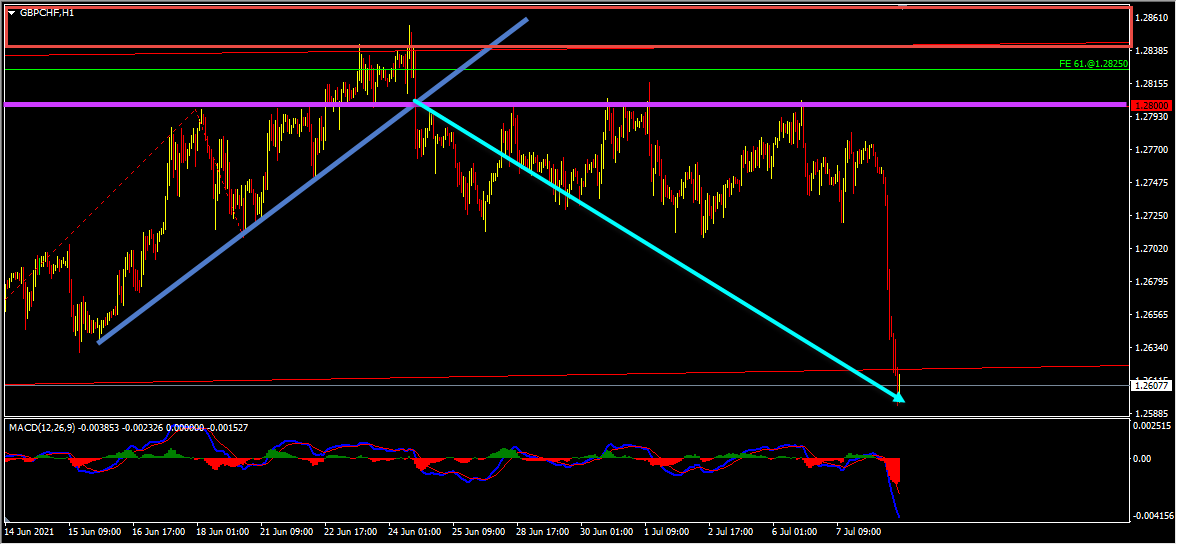 On the H1 chart, the market provided us with various facts supporting the bearish view. After the breakout below the low at 1.28000 and the breakout of the most recent uptrend line, which we may consider as evidences of bearish pressure, the price moved lower and delivered around 90 pips move. We then had a flat correction in the form of a range with the price reaching parallel support and resistance zones but most importantly the price was holding below the key resistance zone. The price which was moving inside this range broke below the bottom of it, which we may consider as yet another evidence of bearish pressure. The price then moved lower further and provided a fantastic move to the downside as you can see in the image below.
(Note: You can learn about a Killer Forex Strategy “Double Trend Line Principle” here)
 So traders when it comes to trading, there are various important factors that we need to pay attention to, just because we have a good setup doesn’t mean that we can enter the trade randomly and it will pay us huge profits. First of all, we need to validate the entry and we should have a perfect entry plan to get into the trade which is a key factor when it comes to trading. This GBPCHF forecast is a perfect example of this scenario.
For similar trade ideas and much more I invite you to
Also, you can get one of our strategies free of charge. You will find all the details here
If you have any further questions, don’t hesitate to drop a comment below!
To your success,
Vladimir Ribakov
Certified Financial Technician


