


Hi Traders! NZDCHF forecast follow up and update is here. On September 8th I shared this “Technical Analysis – NZDCHF Forecast” post in our blog. In this post, let’s do a recap of this setup and see how it has developed now. If you would like to learn more about the way we trade and the technical analysis we use then check out the Traders Academy Club. Spoiler alert – free memberships are available!
My Idea
On the H4 chart, we had a strong bullish momentum and the price which was moving higher has broken above a strong resistance zone (which currently acts as a strong support zone for us after the breakout) and is holding above it. Currently it looks like a correction is happening and I expect the price to possibly continue higher further after this correction. Also, based on the Heikin Ashi candles we can see that currently, we have strong bullish bodies in upward moving market conditions so it basically reflects a bullish environment. In addition to this, currently there are no signs opposing this bullish view and I basically expect the price to continue higher further until the strong support zone shown in the image below holds.

NZDCHF H4(4 Hours) Chart Current Scenario
Based on the above-mentioned analysis my view was bullish here and I was expecting the price to move higher further until the strong support zone holds. The price action followed my analysis here exactly as I expected it to. After the strong bullish move we had a pullback but most importantly the price was holding above the strong support zone. The price then moved higher further and delivered around 80 pips move until it was blocked by a bearish divergence.
 You can see this move clearly on the H1 chart below.
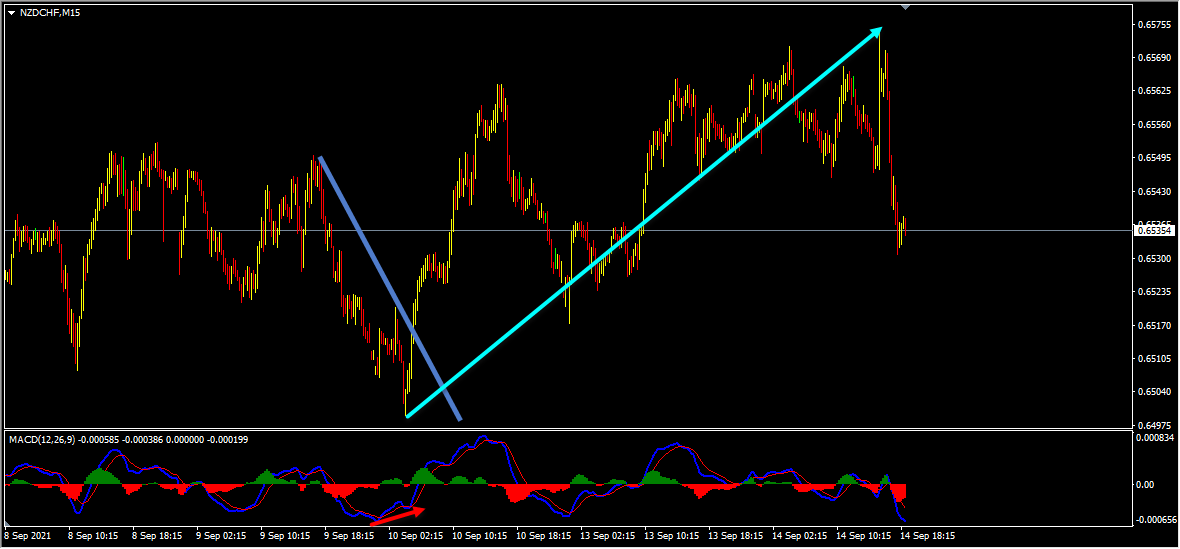
 On the M15 chart, the market provided us with various facts supporting the bullish view. The price which was moving lower created a bullish divergence between the first low that has formed at 0.65074 and the second low that has formed at 0.64994 based on the MACD indicator. The price then moved higher and broke above the most recent downtrend line, we may consider these as facts provided by the market supporting the bullish view. Then as you can see in the image below how the price moved higher after that and provided a nice move to the upside.
(Note: You can learn about a Killer Forex Strategy “Double Trend Line Principle” here)
 As traders we always have two choices, the first one is to fall in love with our analysis and try to convince the market and expect the price to move in the direction as per our wish. The second one is to follow the facts that the market provides us and make the right actions according to that. As you know the first option won’t help us and as you can see in the example above what happened when we followed the facts that the market hinted us and took the right action according to that.
For similar trade ideas and much more I invite you to
Also, you can get one of our strategies free of charge. You will find all the details here
If you have any further questions, don’t hesitate to drop a comment below!
Happy Trading!
Arvinth Akash
Traders Academy Club Team.


