


Hi Traders! USDCHF forecast follow up and update is here. On February 17th I shared this “Technical Analysis – USDCHF Forecast” post in my blog. In this post, let’s do a recap of this setup and see how it has developed now. If you would like to learn more about the way we trade and the technical analysis we use then check out the Traders Academy Club. Spoiler alert – free memberships are available!
My Idea
On the H4 chart, the price has created a bullish divergence between the first low that has formed at 0.88897 and the second low that has formed at 0.88706 based on the MACD indicator. Then the price moved higher and broke above the high at 0.89391 creating higher highs, thus forming a classical setup of bullish divergence followed by bullish convergence. Hence as per the book scenario, after a bullish convergence, we may look for corrections to happen and then further continuation to the upside. Also, the price which is moving higher has broken above the most recent downtrend line which we may consider as another evidence of bullish pressure. So everything looks good here for the bulls and until the strong support zone shown in the screenshot below (marked in blue) holds my view remains bullish here.

USDCHF H4(4 Hours) Chart Current Scenario
Based on the above-mentioned analysis my view was bullish here and I was expecting the price to move higher further. On the H4 chart after the bullish convergence and the breakout of the most recent downtrend line, we had a small pullback and then the price moved higher further as I expected it to, delivering 160+ pips move so far.

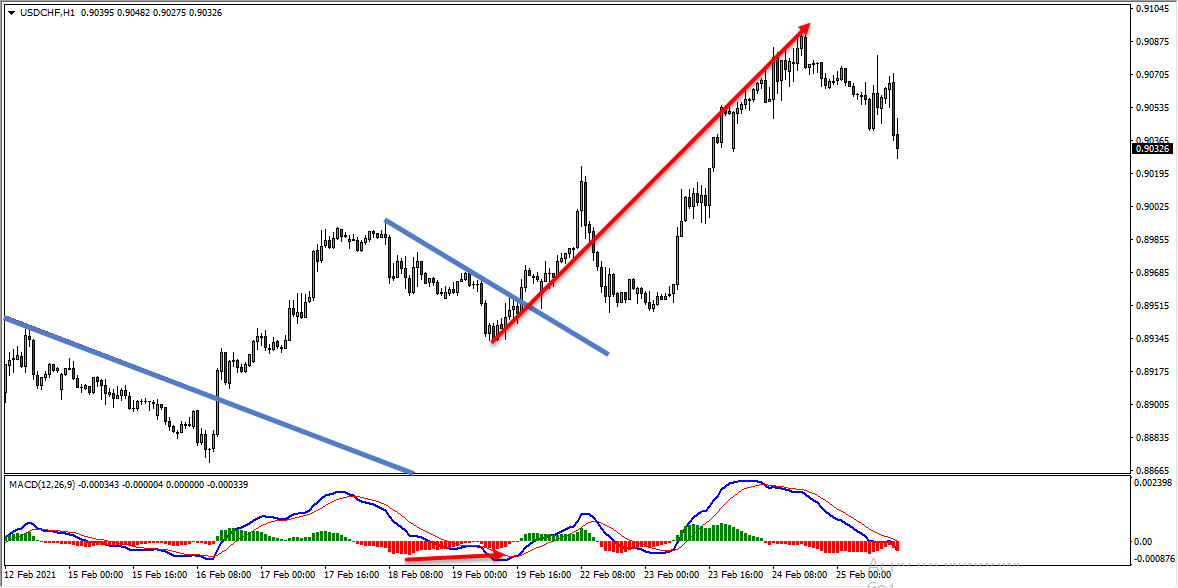
On the H1 chart, the market provided us with various facts supporting the bullish view. The pullback which happened after the bullish convergence and the most recent downtrend line breakout on the H4 chart happened in the form of a double wave down on the H1 chart. In addition to this, the price has also created a bullish divergence that had formed between the first low that has formed at 0.89567, and the second low that has formed at 0.89334 based on the MACD indicator. Then the price moved higher and broke above the most recent downtrend line, we may consider these as facts provided by the market supporting the bullish view. Also, there were no signs opposing this bullish view and then the price moved higher further, providing an amazing move to the upside.
(Note: You can learn about a Killer Forex Strategy “Double Trend Line Principle” here)
As traders we always have two choices, the first one is to fall in love with our analysis and try to convince the market and expect the price to move in the direction as per our wish. The second one is to follow the facts that the market provides us and make the right actions according to that. As you know the first option won’t help us and as you can see in the example above what happened when we followed the facts that the market hinted to us and took the right action according to that.
(Note: You can follow us here on Trading View and also on our blog to get similar ideas on a daily basis)
For similar trade ideas and much more join the Traders Academy Club and get access to our complete watch list and trade report.
This is how the report looks like. A table with the hottest market opportunities, screenshot behind every pair and time frame (anything that is in blue inside the table is clickable and leads to a screenshot) + a summary in text format, kind of highlights. And of course Live Market Analysis every single day.

If you have any further questions, don’t hesitate to drop a comment below!
To your success,
Vladimir Ribakov
Certified Financial Technician


