




Welcome back to our weekly Forex forecast at Home Trader Club.
This week, we are looking at five markets offering potentially interesting trading opportunities: EUR/USD, EUR/GBP, USD/JPY, Gold and the S&P 500.
Our primary strategy is to sell the rallies rather than chase the market lower. Across these instruments, we are watching important resistance zones, broken support levels, supply areas, bearish divergence and price-action confirmation to identify potential short-selling opportunities.
The markets have recently demonstrated how quickly sentiment can change. US inflation data surprised investors, yet the US dollar moved in the opposite direction to what many traders initially expected. This reaction highlights an important lesson: financial markets respond not only to economic data itself but also to expectations, positioning and what investors believe will happen next.
- 1 Trade with AvaTrade and Unlock Unlimited Home Trader Club Access
- 2 Watch the Full Weekly Forecast Video
- 3 1. EUR/USD Forecast: Sell the Rallies
- 4 2. EUR/GBP Forecast: A Potential Pullback Before Another Move Lower
- 5 3. USD/JPY Forecast: Bearish Divergence Signals Caution
- 6 4. Gold Forecast: More Downside Before a Potential Long-Term Recovery?
- 7 5. S&P 500 Forecast: Bearish Divergence and a Potential False Breakout
- 8 Final Thoughts: Sell the Rallies, but Wait for Confirmation
- 9 Join the Home Trader Club
Trade with AvaTrade and Unlock Unlimited Home Trader Club Access
We have partnered with AvaTrade, one of the industry’s leading regulated brokers.
When you open and trade with AvaTrade through our partnership, you receive:
- Unlimited access to Home Trader Club
- Real-time trading education
- Daily and swing trading opportunities
- Our complete educational library
- Access to our Trade Copier Project
- Members-only trading community
If you’re looking to accelerate your trading journey while enjoying premium education, this partnership gives you everything you need under one roof.
If you already have account with them, still follow this link to open separate account with separate email. Once you did that, contact me with the telegram link below and we will give you the access.
 Watch the Full Weekly Forecast Video
So, what comes next?
Let’s examine the charts, identify the important technical structures and discuss the trading scenarios we are watching this week.
1. EUR/USD Forecast: Sell the Rallies
The EUR/USD pair remains one of the markets on our watchlist for potential bearish opportunities.
Following the recent price action, the pair is retesting a previously broken resistance area that has the potential to act as resistance again.
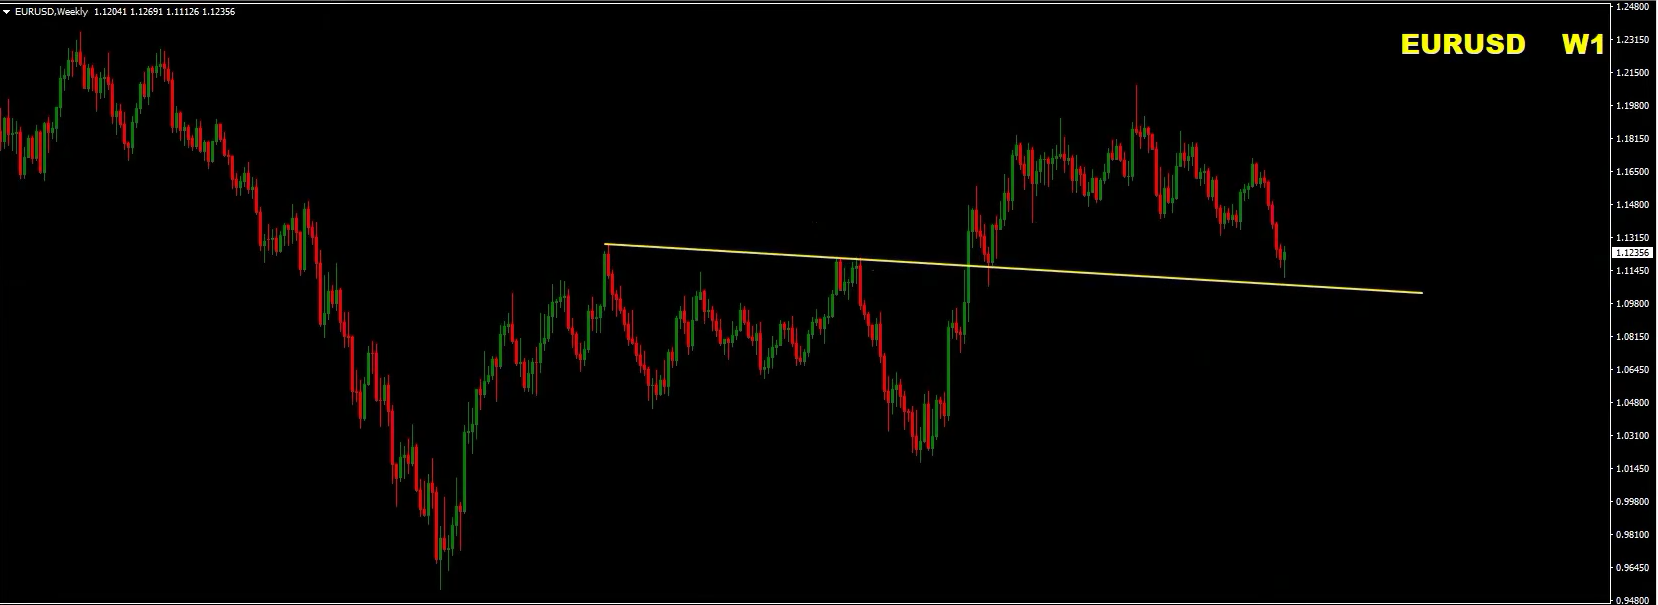
Although the market continues to move within its existing channel, we have not yet seen convincing technical evidence that the broader bearish structure has ended.
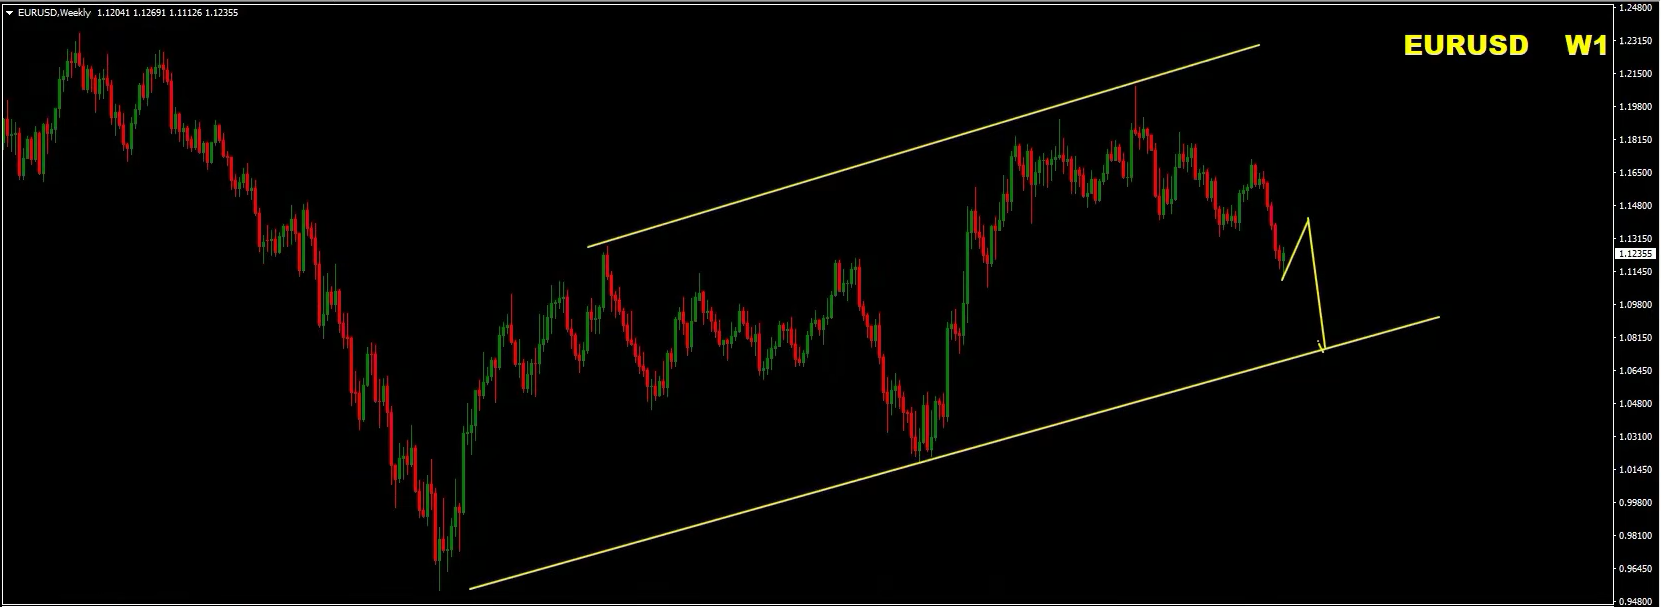
From a technical perspective, this keeps the sell-the-rallies approach in focus.
Daily Chart Analysis
On the daily chart, EUR/USD is approaching an important technical area where previous support and resistance levels could influence the next move.
The main factors we are watching include:
- A broken resistance area that may now act as resistance.
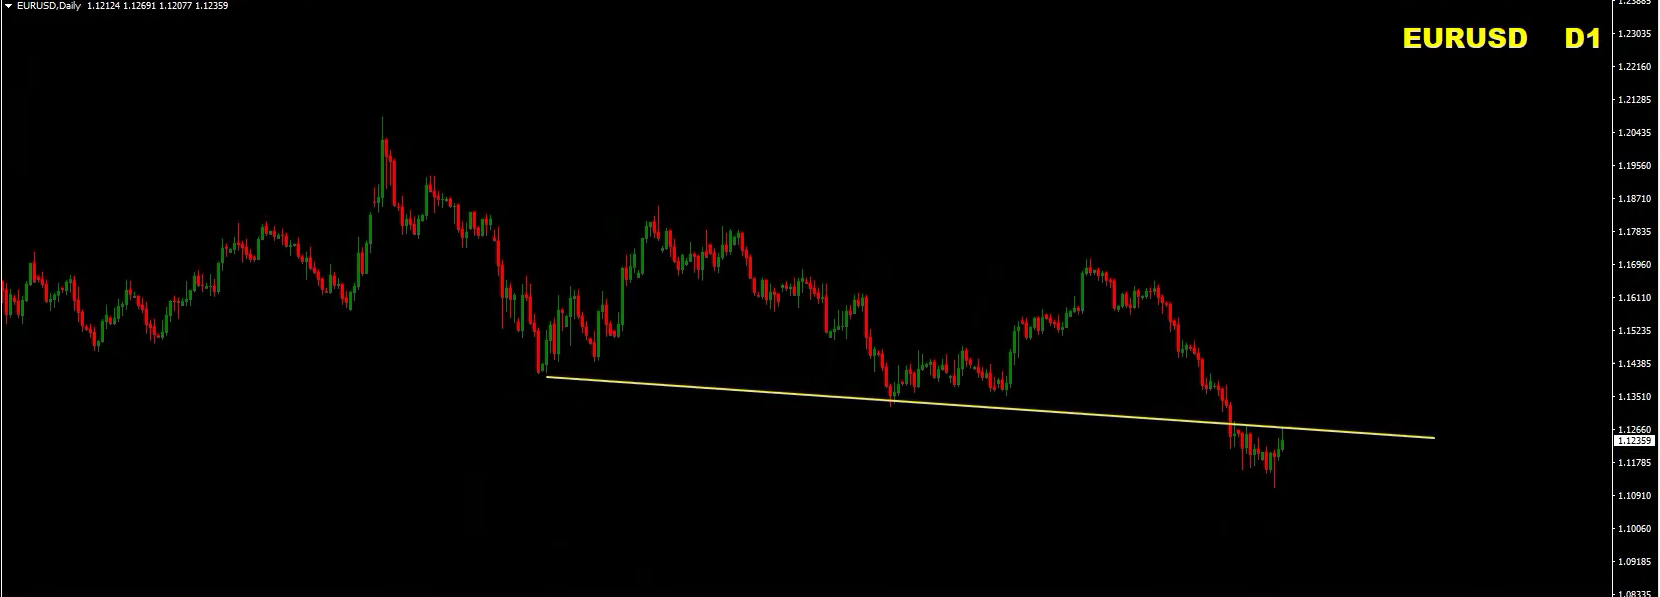
- A horizontal support zone that could influence short-term price movement.
- A dynamic resistance line that may limit bullish retracements.
- The broader channel structure, which remains important for identifying the prevailing trend.
As long as the relevant resistance area holds, a temporary bullish recovery could provide an opportunity to look for bearish confirmation.
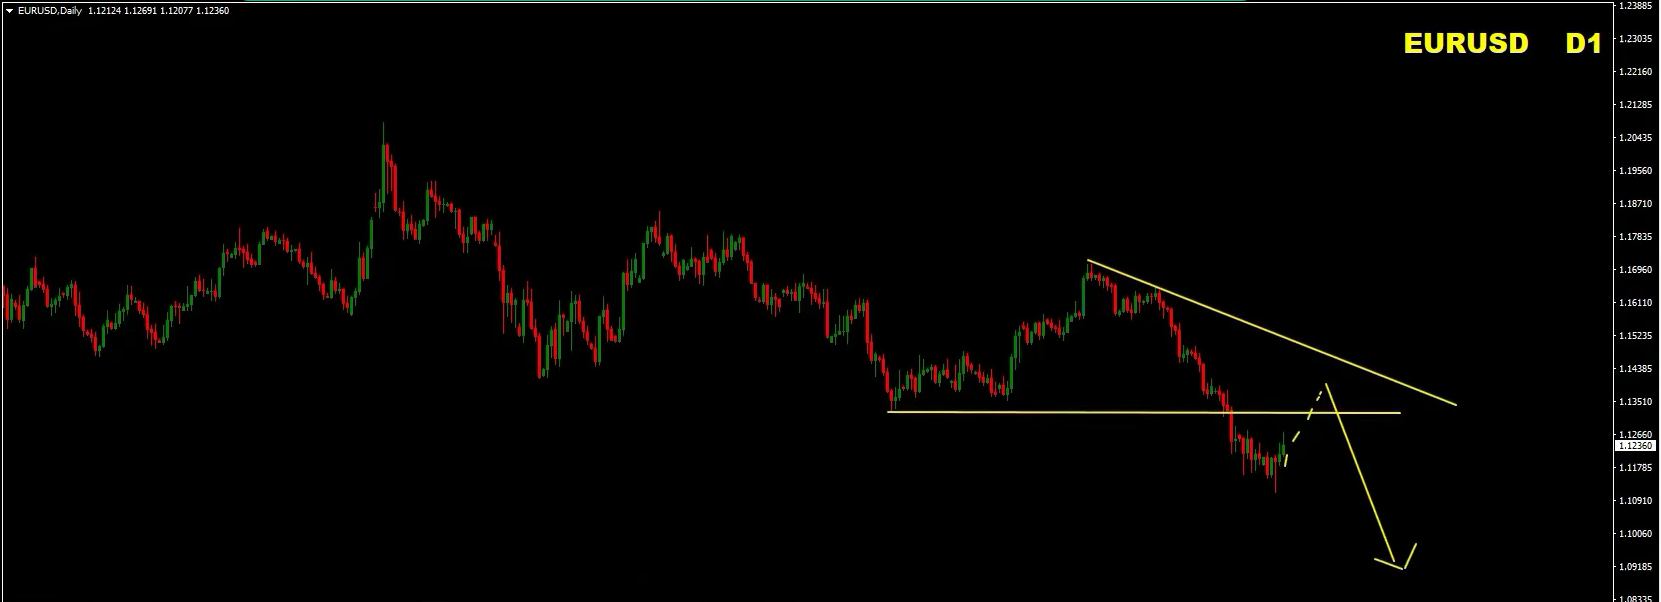
The key is not to sell simply because the market has rallied. We want to see how price behaves when it reaches resistance.
Four-Hour Chart: Watch for Bearish Confirmation
The four-hour chart has developed bullish divergence, suggesting that selling momentum may be weakening temporarily.
This does not automatically mean that the broader trend has reversed. Instead, it raises the possibility of a corrective move, potentially in the form of an ABCD pattern or a ranging structure.
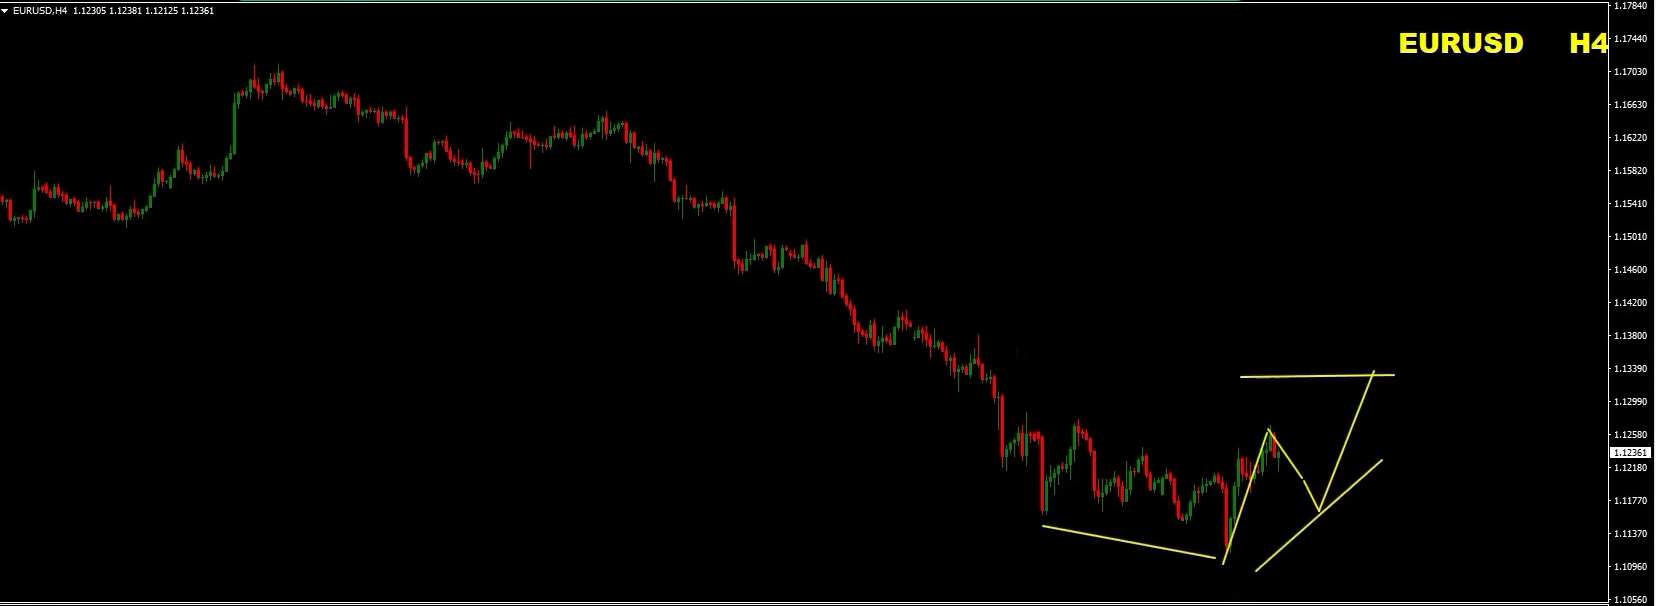
For our trading plan, this creates two important considerations:
- Allow the corrective movement to develop toward a relevant resistance area.
- Look for bearish price action or a renewed downside structure before considering a short position.
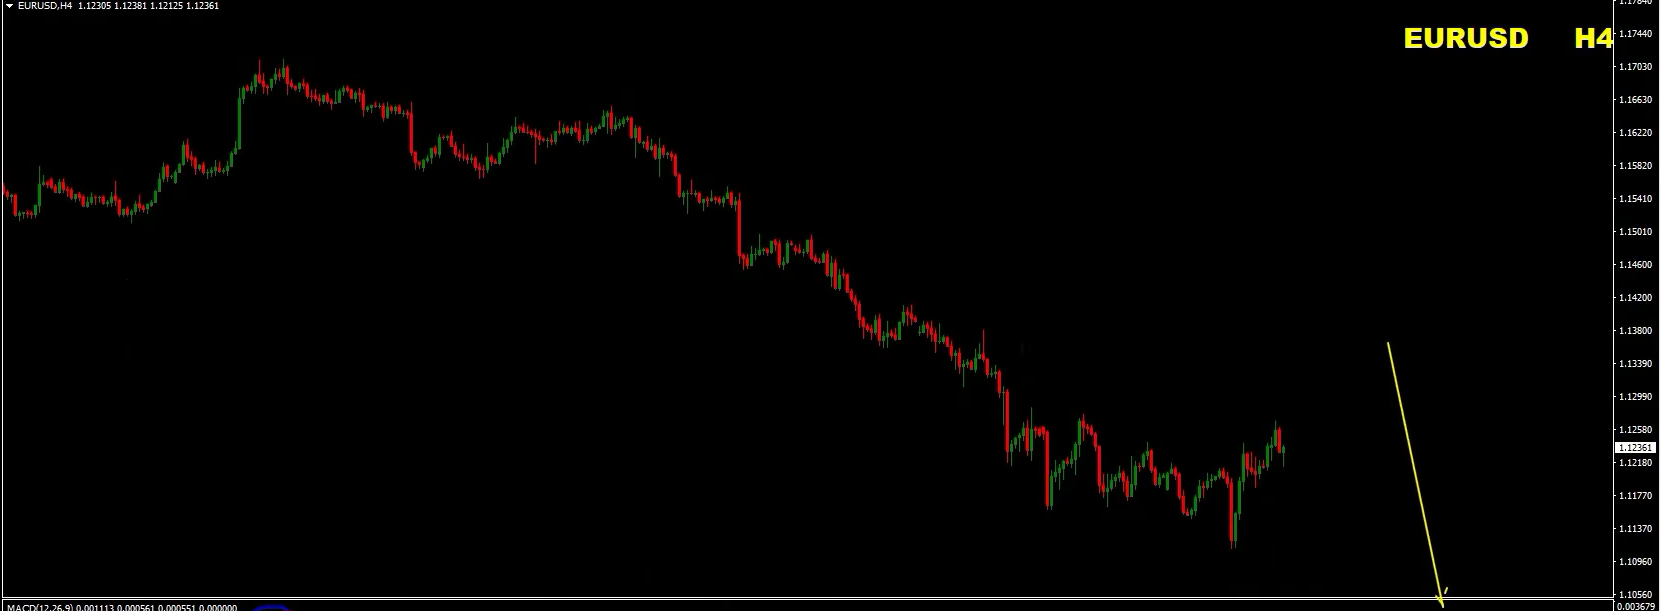
EUR/USD trading outlook: Bearish while the key resistance area holds. Short-term rallies may create opportunities to sell, provided the market confirms the setup.
2. EUR/GBP Forecast: A Potential Pullback Before Another Move Lower
EUR/GBP remains bearish in our broader outlook, with the previous lows around 0.8200 representing a longer-term downside area to monitor.
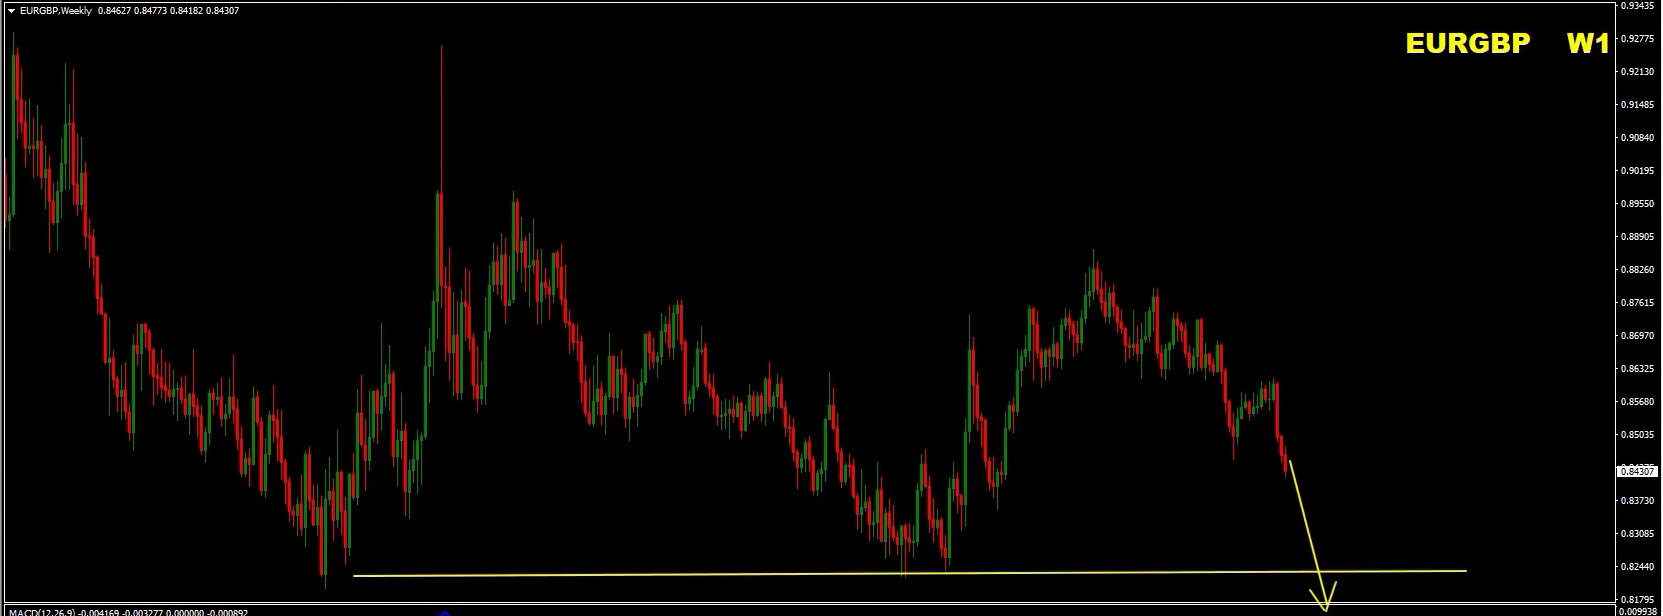
However, the market is approaching an important technical support structure. This means a temporary recovery could develop before the next potential bearish leg.
The distinction between the short-term and long-term outlook is essential here. A corrective rally does not necessarily invalidate a broader bearish trend.
Weekly Chart Analysis
The weekly chart highlights several important technical factors:
- A descending channel structure.
- Historical lows that may act as support.
- A rising support line that could influence the current price movement.
- A demand area where buyers may attempt a temporary recovery.
With price approaching the lower portion of the channel, a short-term bounce is a scenario worth considering.
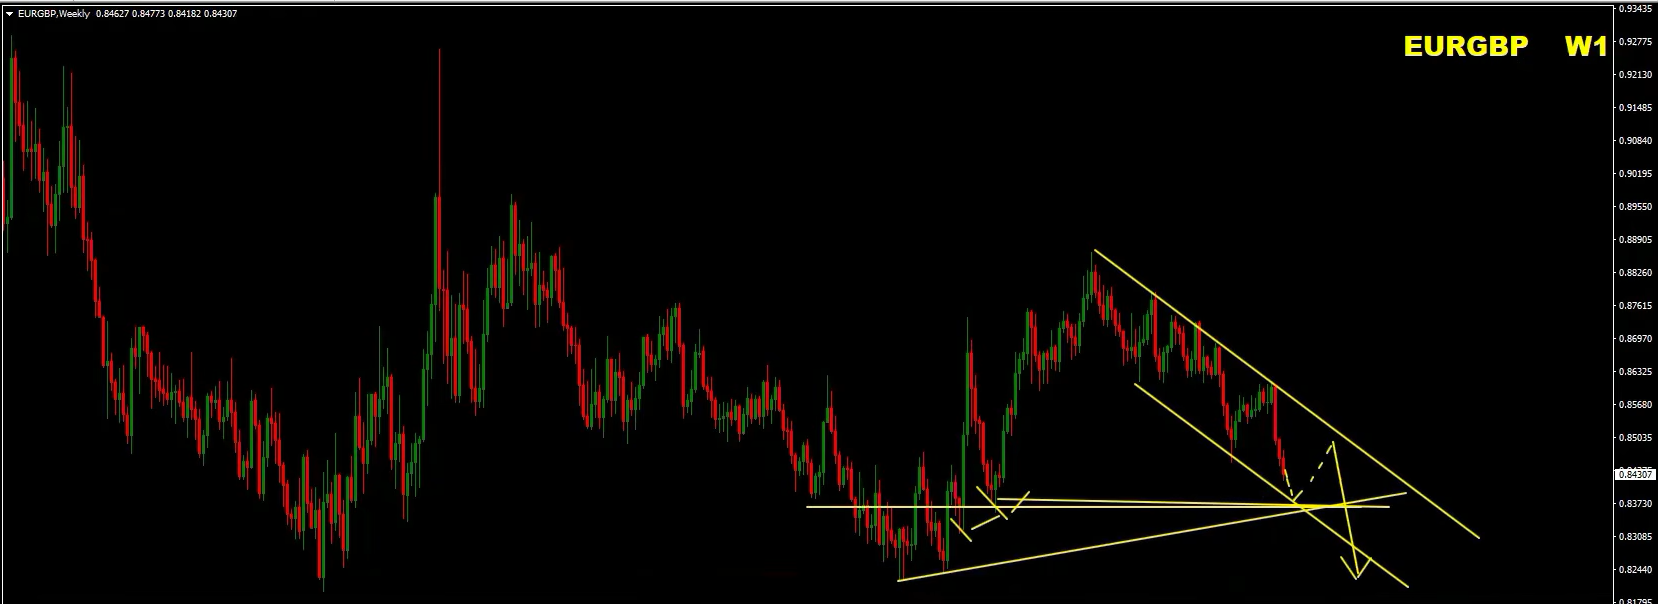
Rather than chasing the market lower directly into support, we want to see whether the pair can recover toward a more attractive selling area.
Four-Hour Chart: Supply Zones Matter
The four-hour chart is showing bullish divergence, which may indicate that a corrective recovery is developing.
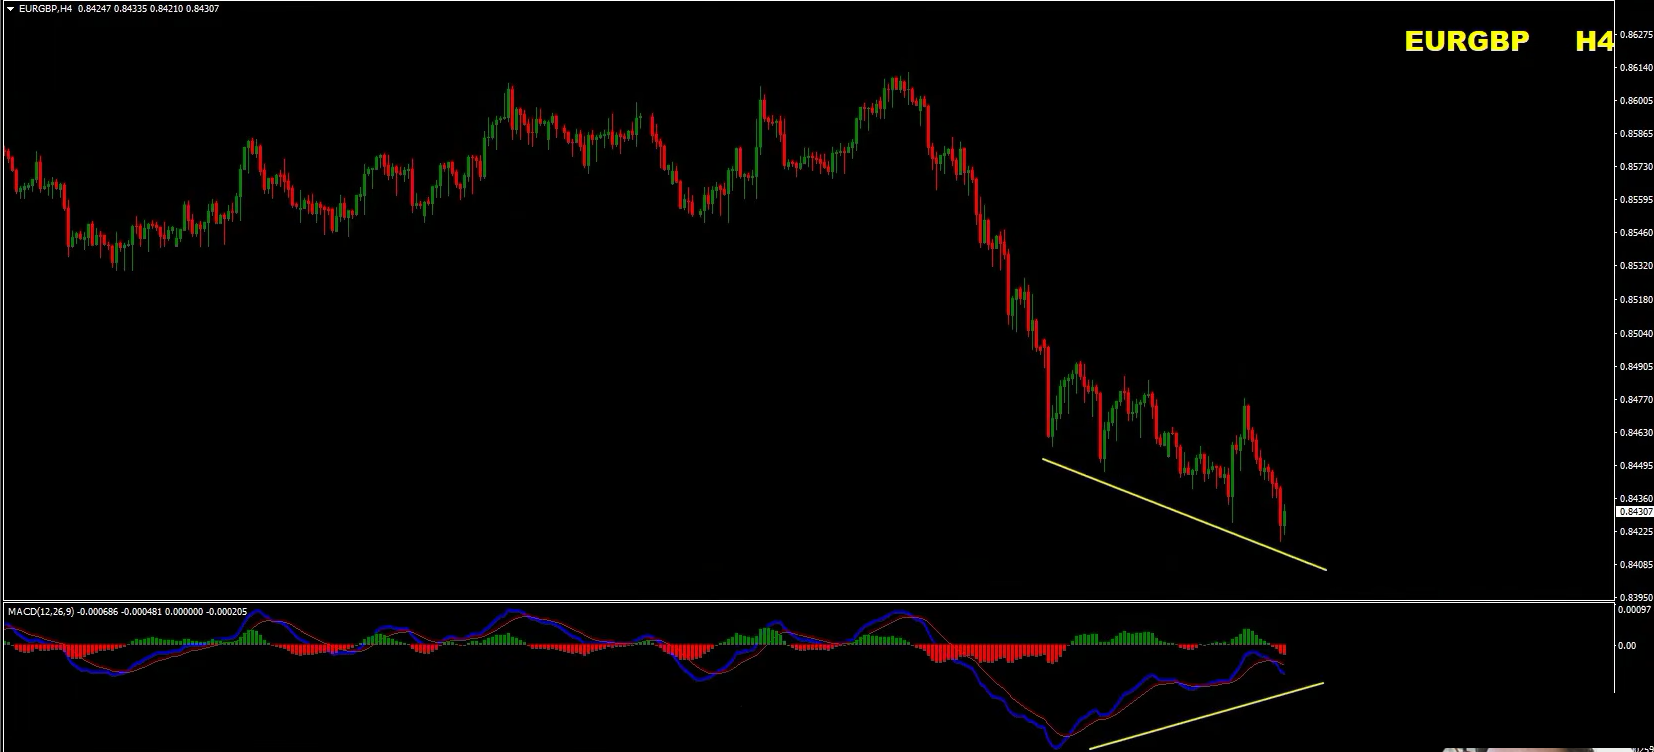
We are watching several resistance areas that could become relevant if price moves higher:
- Major supply zones.
- Previous support levels that have now been broken.
- Horizontal resistance areas.
- The upper boundary of the current bearish structure.
If EUR/GBP rallies into these areas and produces convincing bearish confirmation, the next downside move could offer a more favourable trading opportunity.
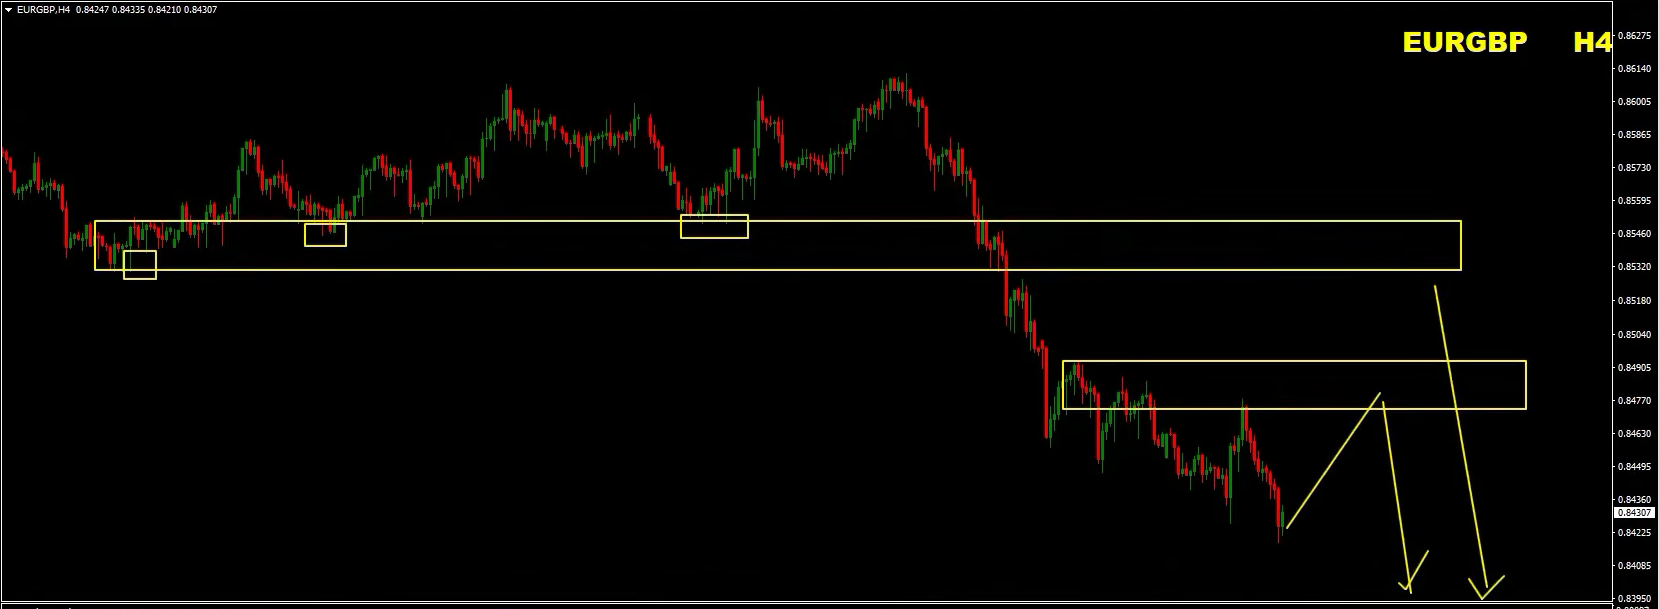
Our longer-term reference remains the previous lows around 0.8200, although price must first confirm that the bearish trend is resuming.
EUR/GBP trading outlook: A short-term recovery is possible, but the broader outlook remains bearish while the major resistance zones hold.
3. USD/JPY Forecast: Bearish Divergence Signals Caution
USD/JPY is another market where we are watching for potential selling opportunities at higher levels.
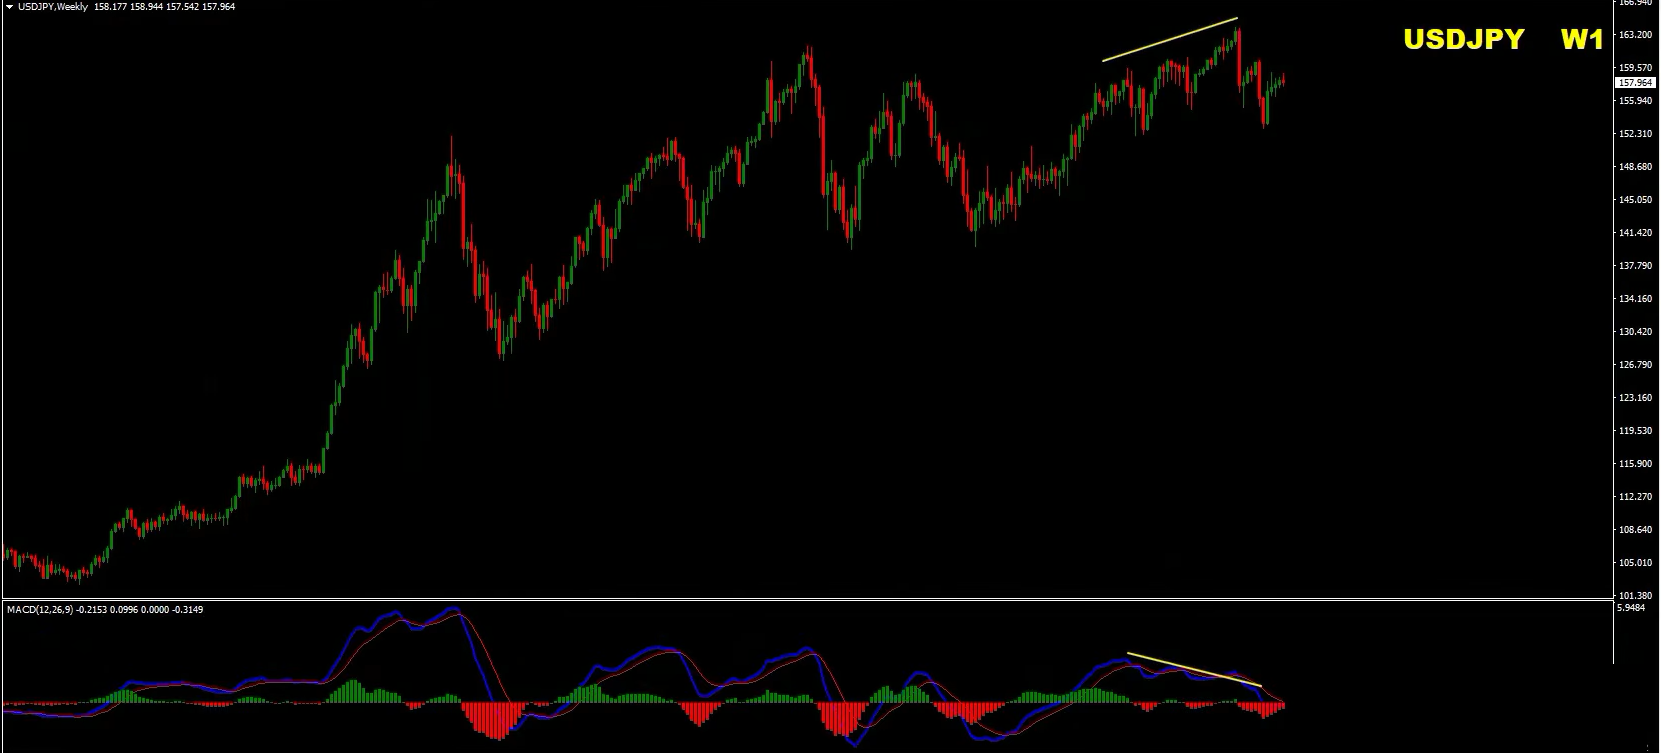
The key feature is the bearish momentum structure developing across multiple timeframes. This makes the pair particularly interesting from a technical-analysis perspective.
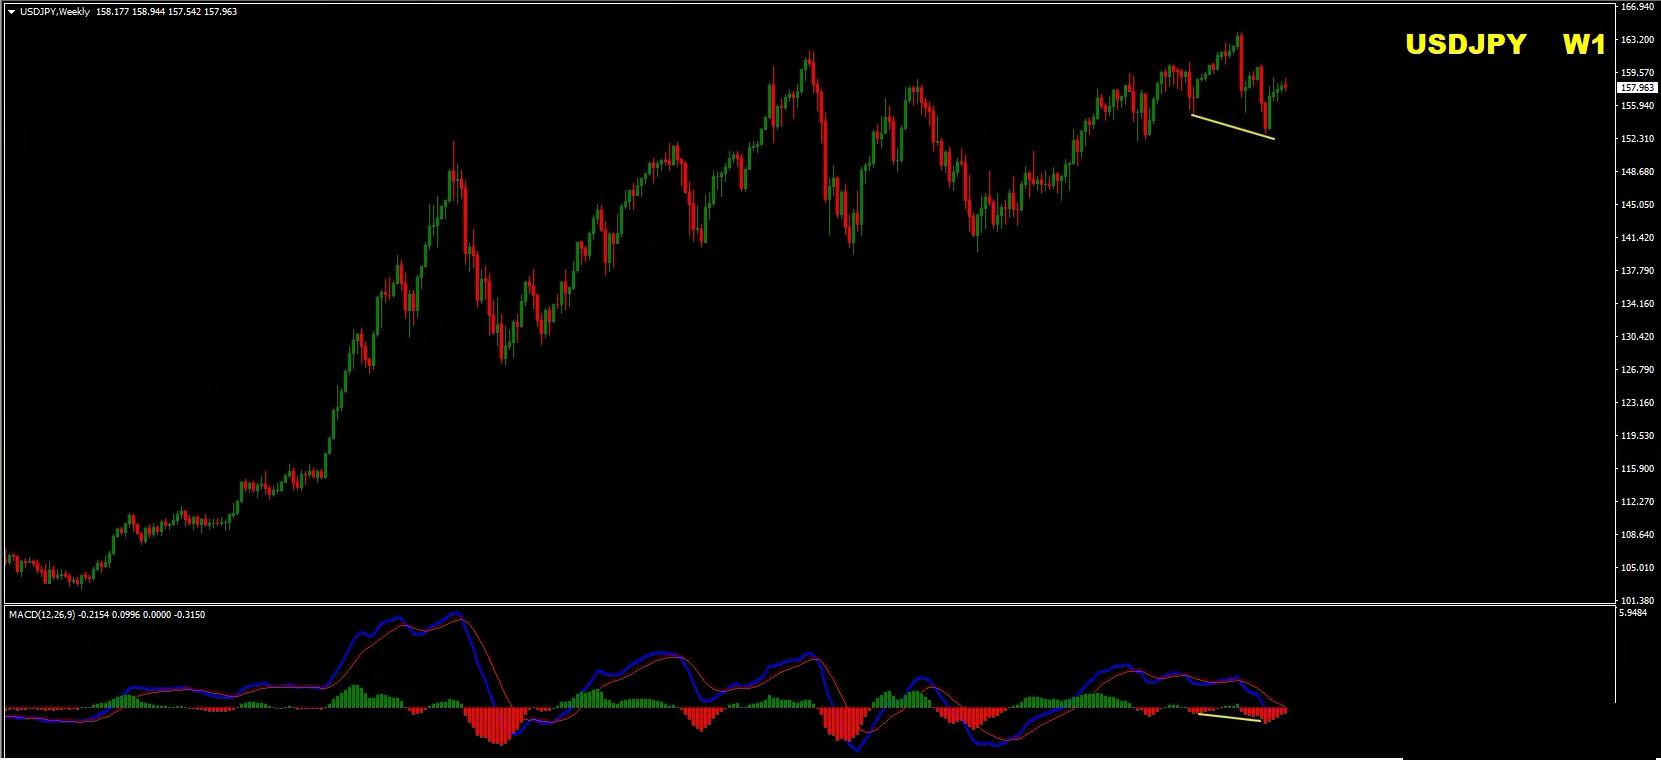
Weekly Chart: Bearish Divergence
The weekly chart shows price forming higher highs while the MACD indicator forms lower highs.
This is a classic example of bearish divergence. It suggests that the upward price movement is not being supported by the same strength in momentum.
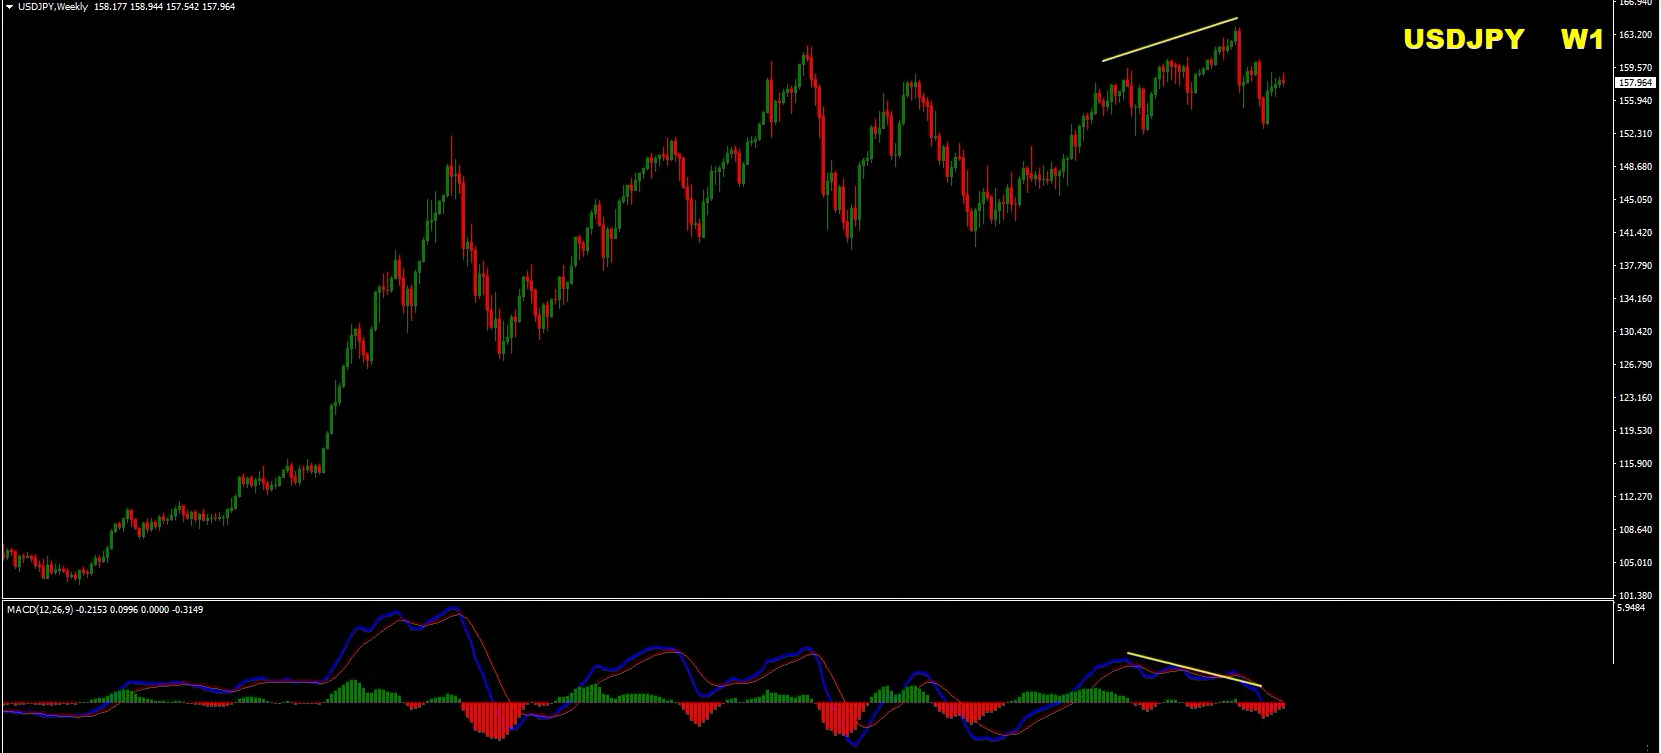
Divergence alone is not a sell signal, and it does not guarantee an immediate reversal. However, when combined with resistance, supply zones and bearish price structure, it can strengthen the case for a potential downside move.
The subsequent momentum behaviour with the price and the MACD creating lower lows also adds to the bearish picture, with the MACD histogram showing changes in momentum consistent with weakening bullish pressure.
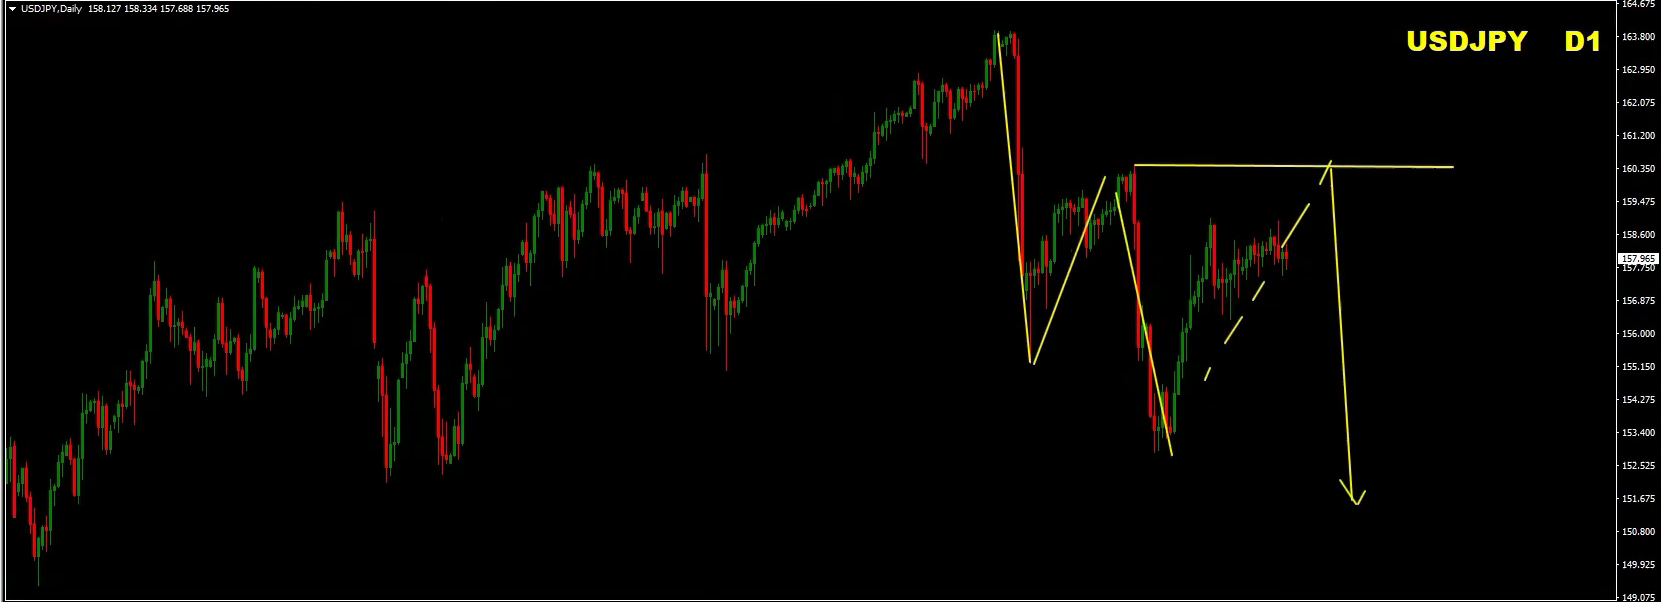
Daily Chart: Lower Highs and Lower Lows
The daily chart is displaying a more developed bearish structure, with lower highs and lower lows.
The recent high is also acting as an important supply area. As long as this zone holds, we will be watching for rallies that fail to break resistance.
A continuation of the bearish structure would provide additional confirmation that sellers are regaining control.
Four-Hour Chart: Two Possible Scenarios
The four-hour chart has also developed bearish divergence, creating two potential trading scenarios.
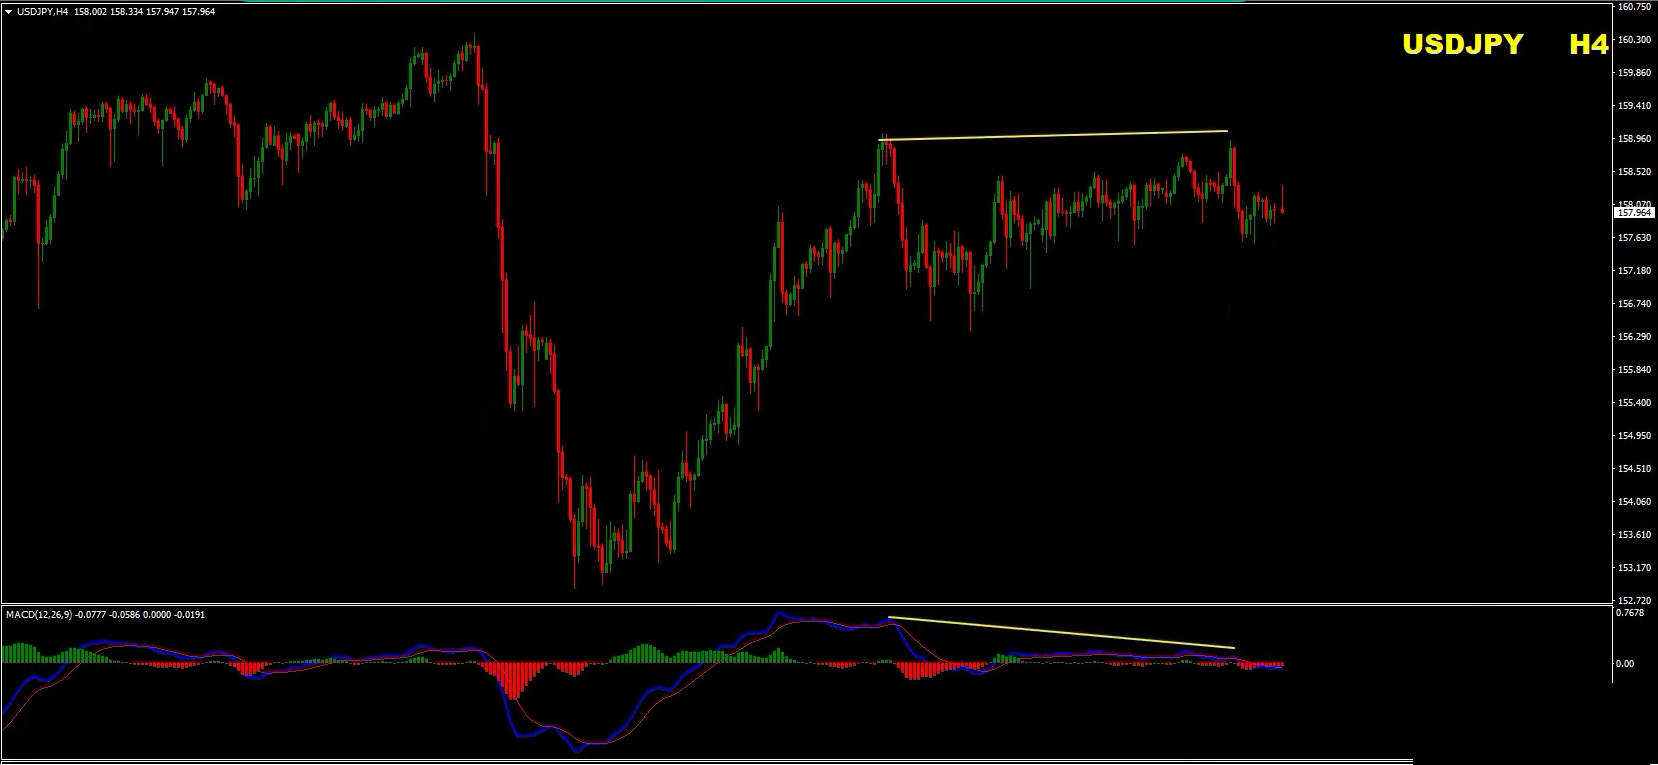
Scenario A: A final upward push
Price could make one more move higher to test or sweep liquidity around the recent highs before reversing lower.
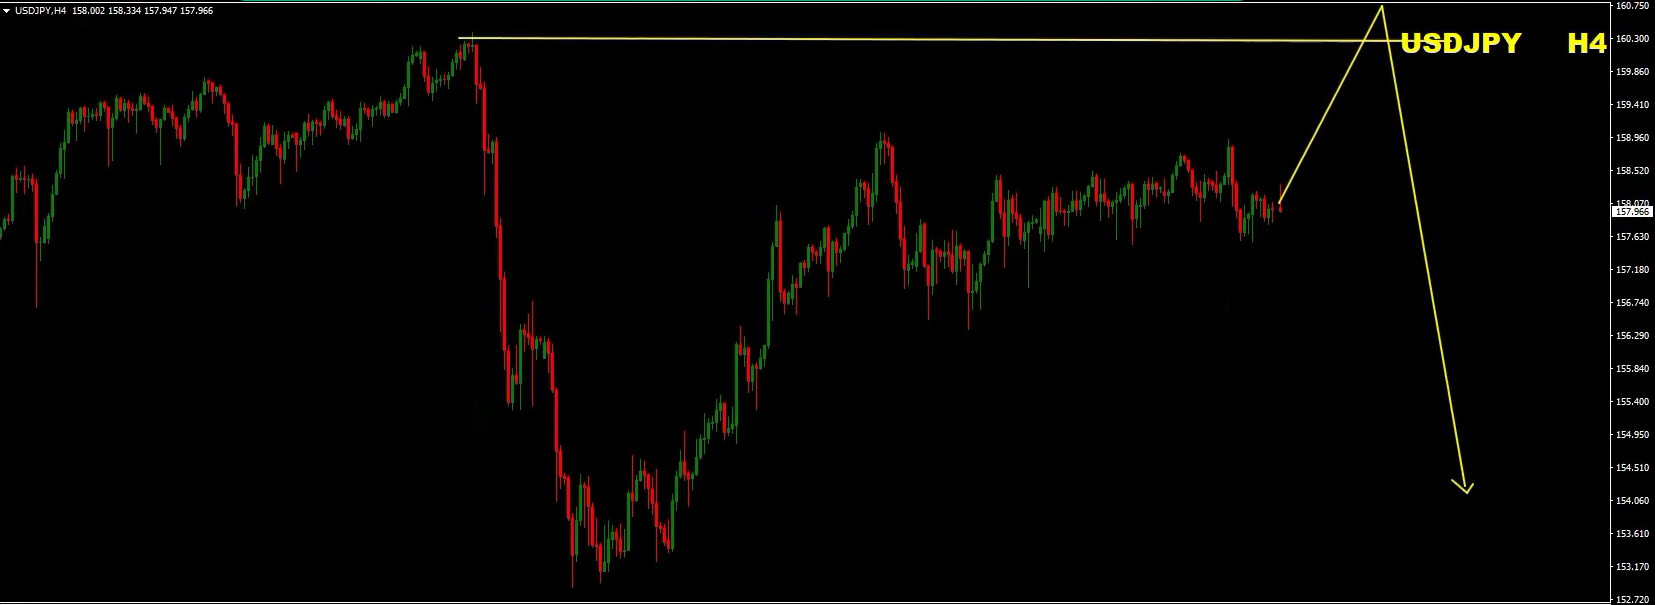
Scenario B: A corrective pullback
The market could continue forming lower highs and lower lows, followed by a pullback. A subsequent break of the corrective structure could provide a bearish entry trigger.
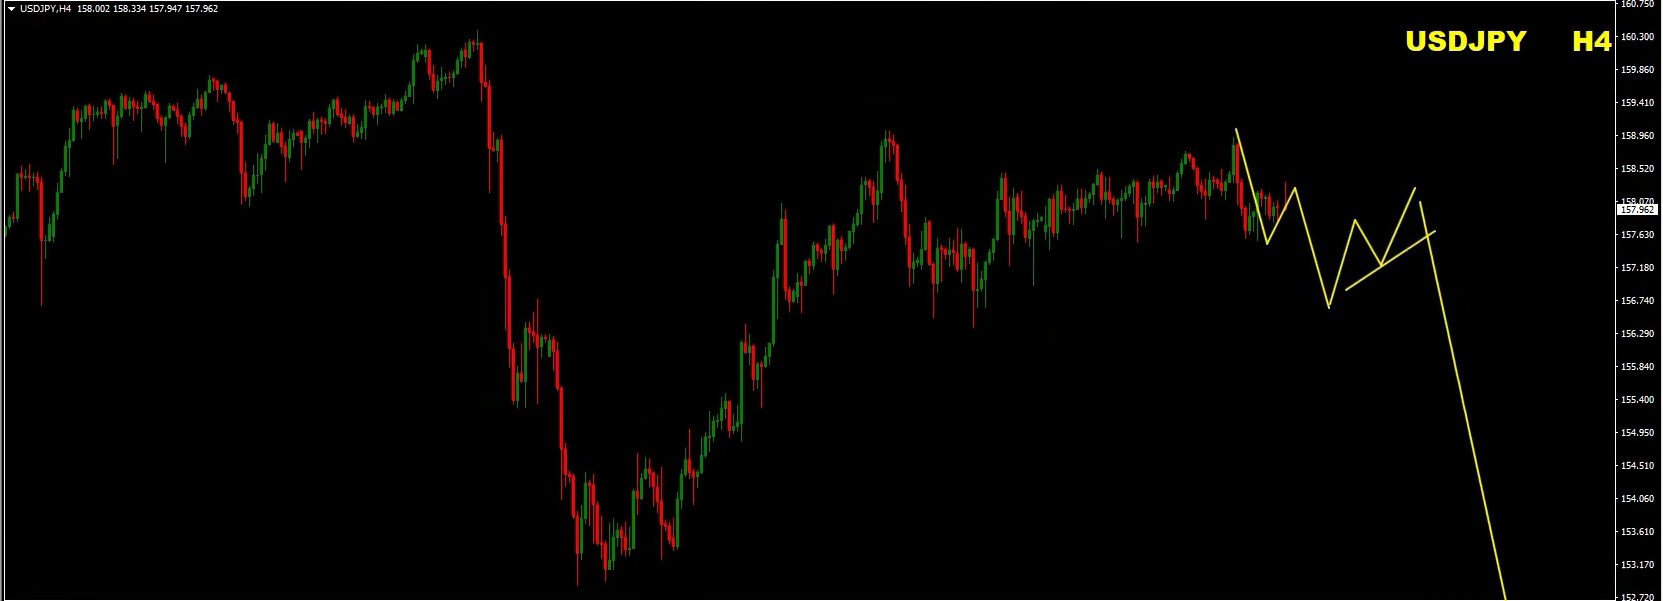
The second scenario would allow traders to wait for confirmation rather than attempting to predict the exact top.
Important USD/JPY Levels
The broad resistance area identified in the analysis is approximately 159.50–161.00.
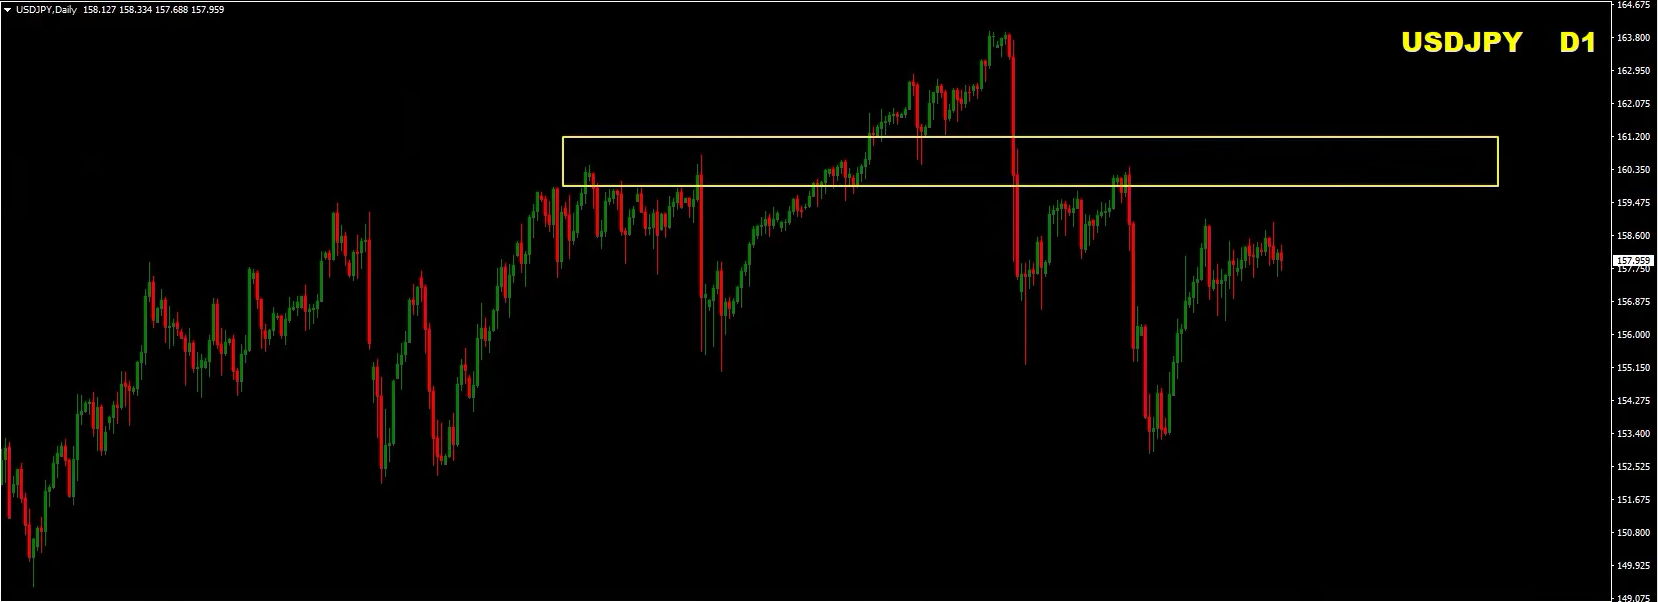
Potential downside reference levels are:
- 156.00
- 155.00
- 153.00
- 150.00
These are areas to monitor, not guaranteed price targets. Traders should confirm the current market structure and the validity of these levels on their own charts before taking a position.
USD/JPY trading outlook: Bearish while the 159.50–161.00 resistance region holds. A short-term rally remains possible, but we are looking for bearish confirmation before considering a sell.
4. Gold Forecast: More Downside Before a Potential Long-Term Recovery?
Gold remains an important market to watch this week.
Although the longer-term picture may eventually offer a bullish opportunity, the current technical structure keeps us cautious about buying too early.
Our near-term plan is to watch for selling opportunities during corrective rallies, particularly when price approaches broken support, supply zones and descending resistance.
Daily Chart: Broken Support Becomes Resistance
Gold is showing several technical features that may limit a short-term recovery:
- Previously broken support acting as resistance.
- Historical highs forming a supply zone.
- A falling resistance line.
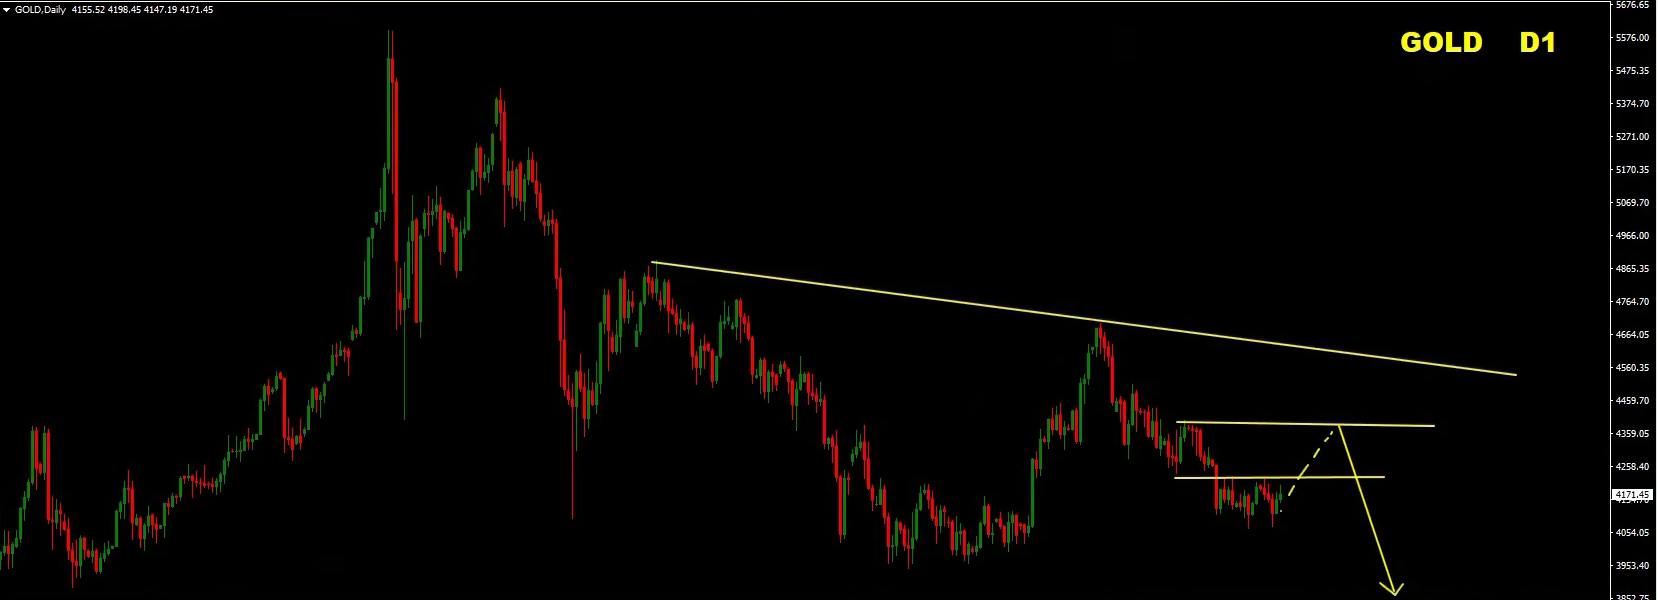
- Potential corrective price action following the recent decline.
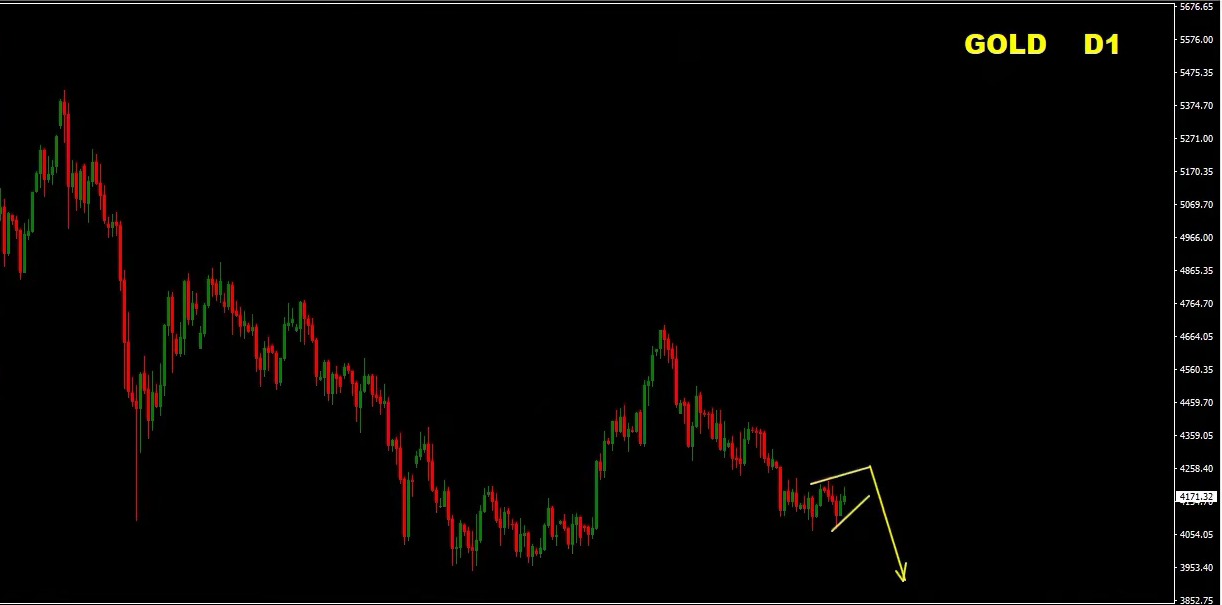
When a support level breaks, it can become a resistance area during a subsequent retest. This is one of the structures we are watching on the gold chart.
If price rallies into this region and fails to break higher, bearish confirmation could provide a potential short-selling opportunity.
Four-Hour Chart: Look for a Rally Into Resistance
The four-hour chart provides a clearer view of the resistance structure.
A previously important support area has been broken and is now being tested from below. Several historical highs also contribute to the supply zone.
The preferred scenario is to wait for a retracement toward these resistance areas and then assess whether sellers regain control.
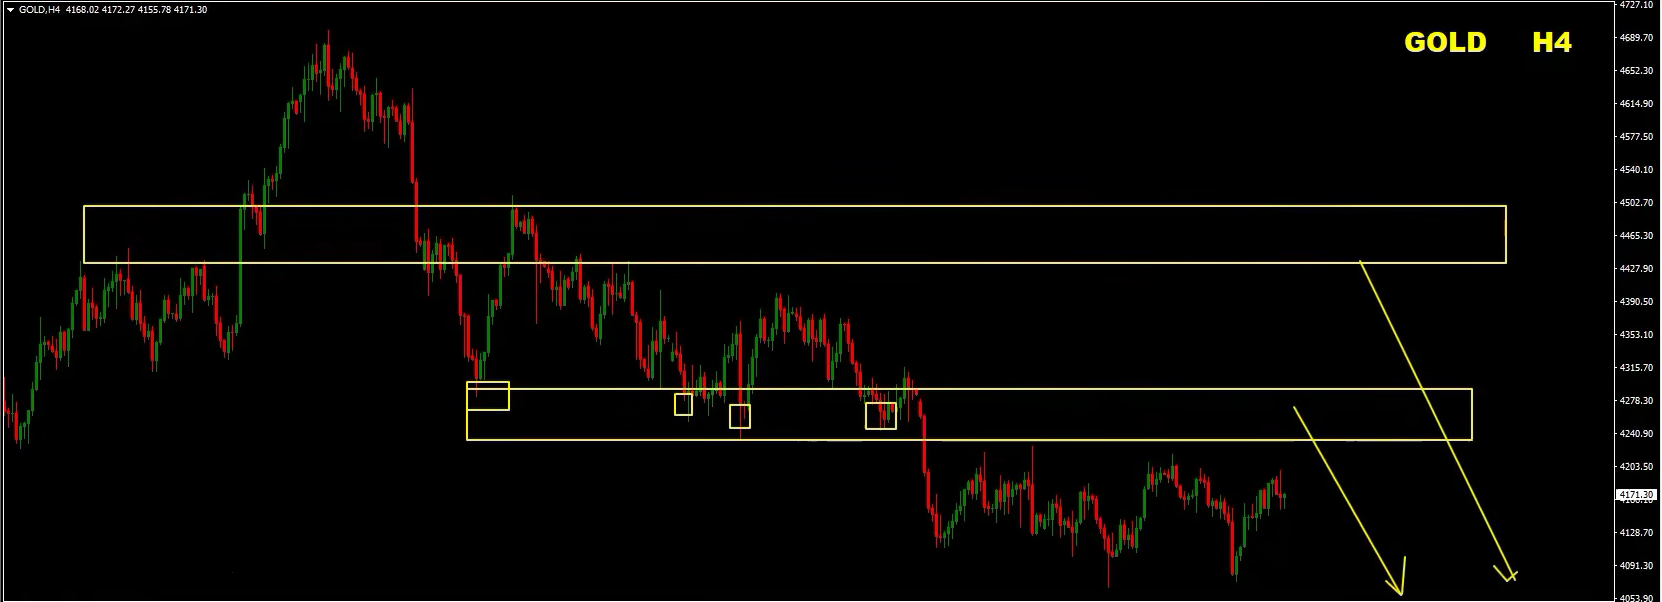
This approach offers a more structured alternative to selling after an extended decline, when the market may already be approaching support.
The Longer-Term Gold Outlook
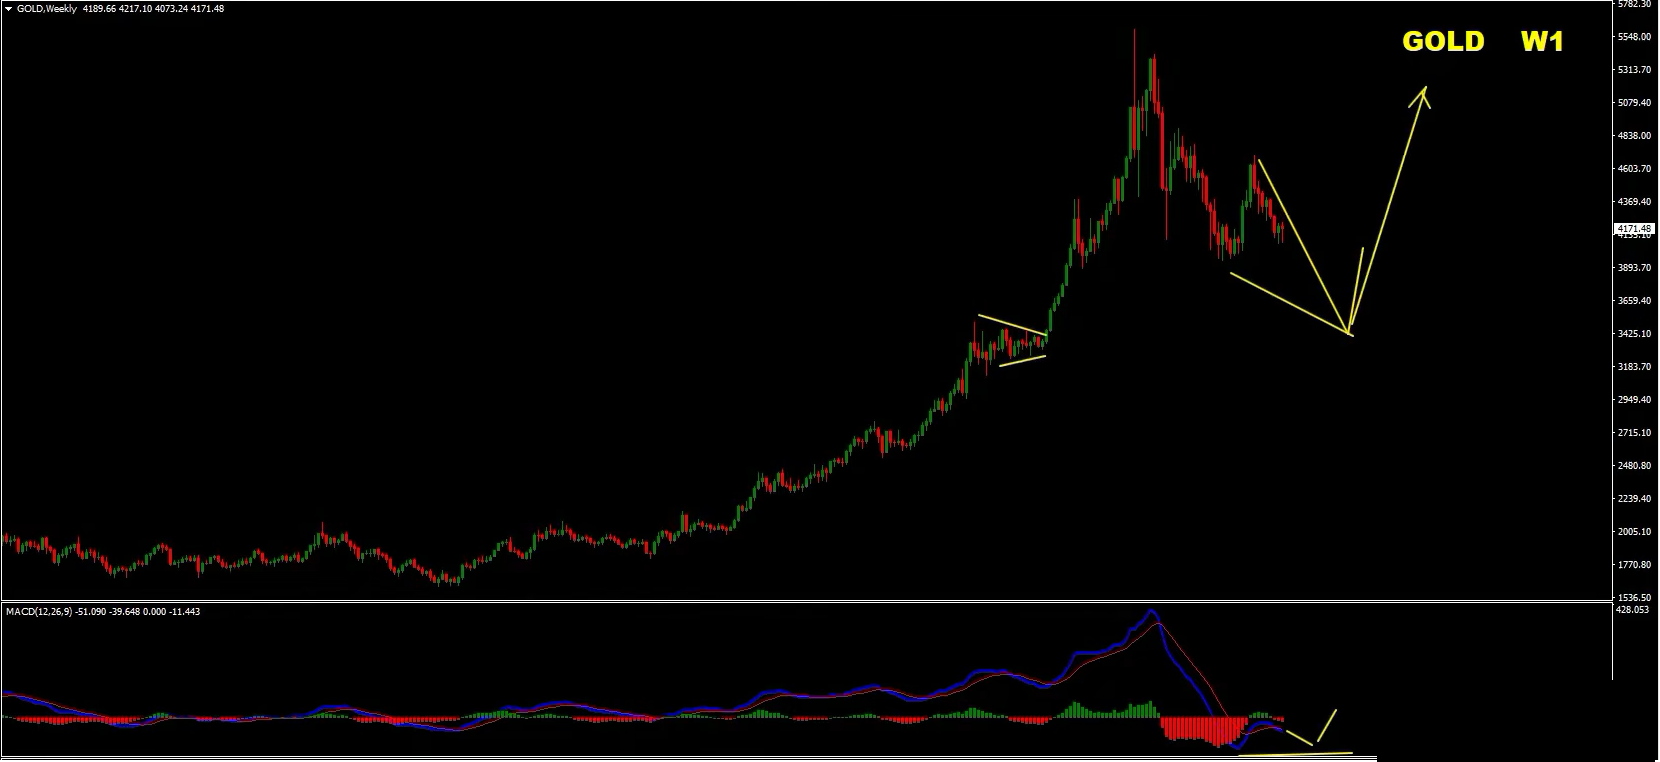
Despite the near-term bearish bias, the longer-term outlook could change if gold completes a deeper correction and develops convincing bullish divergence.
The area around $3,500 is a potential region of interest in the original analysis, where a completed bearish move and improving momentum could create conditions for a longer-term buying opportunity.
However, this remains a scenario rather than a confirmed reversal. We would want to see the price structure stabilise and bullish confirmation emerge before considering a change in bias.
Gold trading outlook: Bearish in the near term while the relevant resistance and supply zones hold. A potential longer-term buying opportunity may develop after further downside and confirmation of a bullish reversal.
5. S&P 500 Forecast: Bearish Divergence and a Potential False Breakout
The S&P 500 is the final market on our weekly watchlist, and the technical structure suggests that caution is warranted.
Weekly Chart: Bearish Divergence
The weekly chart shows bearish divergence, with price advancing while momentum fails to confirm the move.
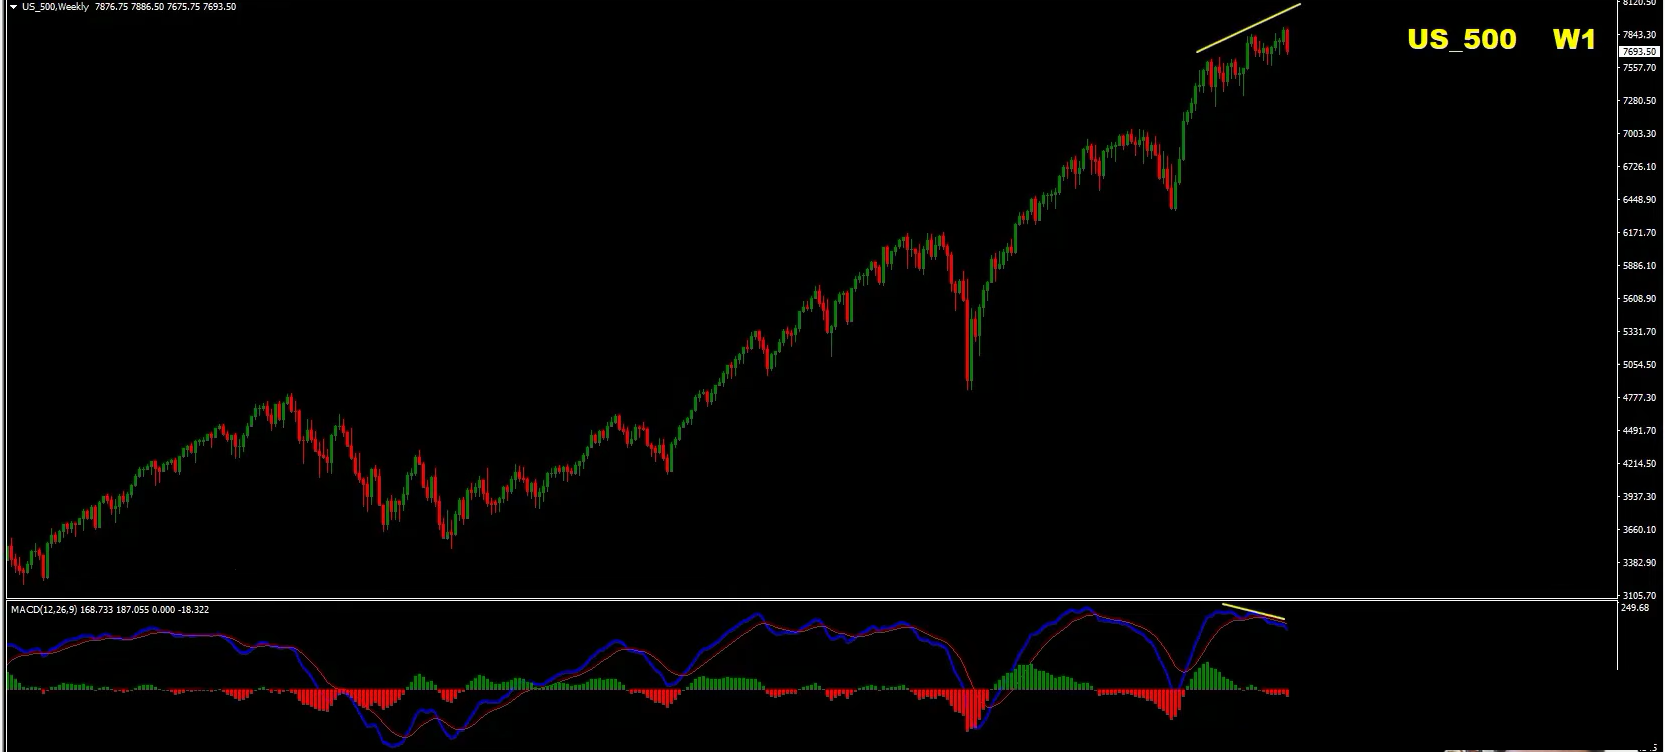
A bearish engulfing candle near the highs adds another warning sign. This type of candle can indicate that selling pressure is emerging after an upward move.
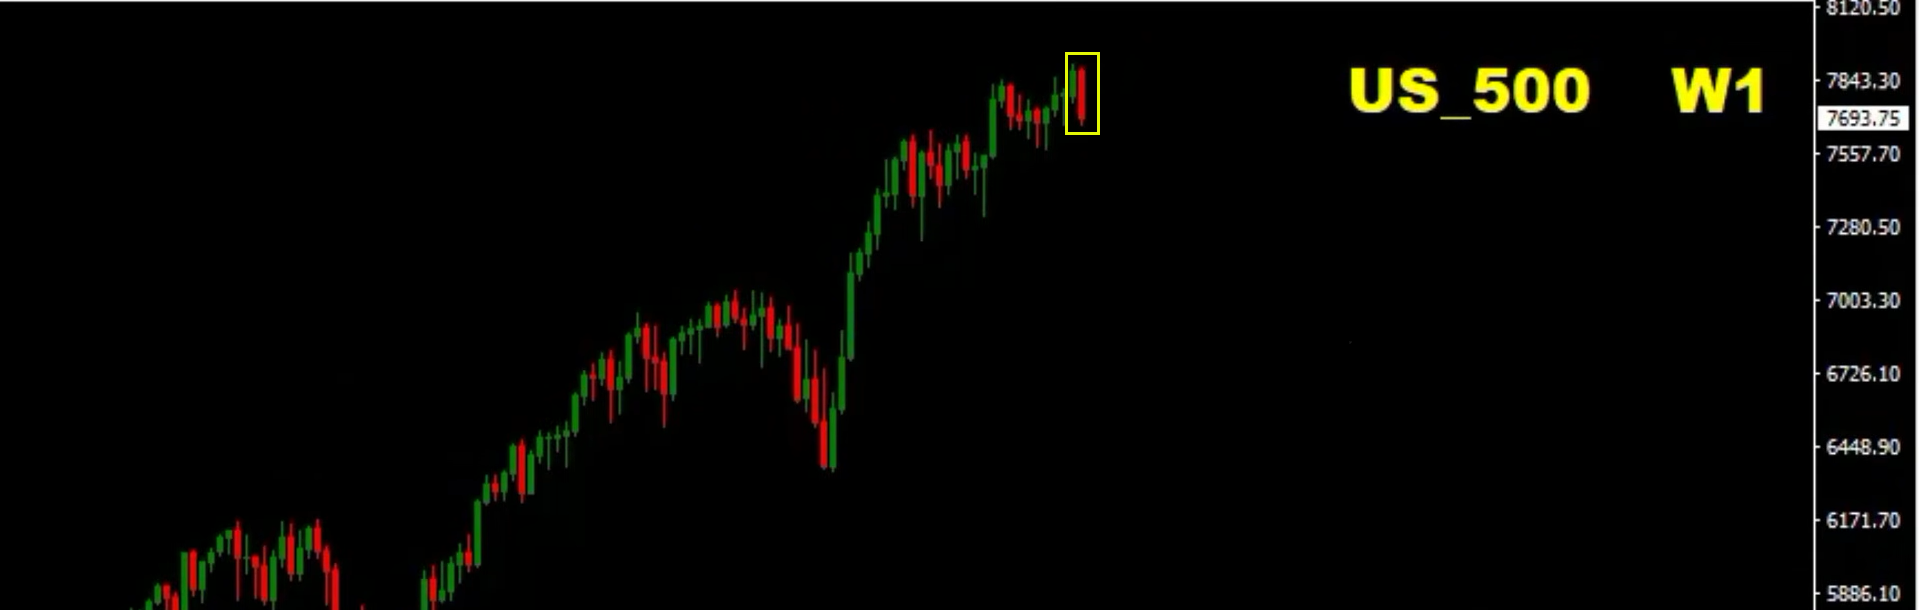
Neither divergence nor a bearish engulfing candle guarantees a decline. Their importance increases when the market subsequently breaks support or forms a bearish price structure.
Daily Chart: Watch for a False Breakout
The daily chart is showing another bearish divergence structure, alongside a potential false breakout near a recent high.
A false breakout occurs when price moves beyond an important level but fails to sustain the move and subsequently returns below that level.
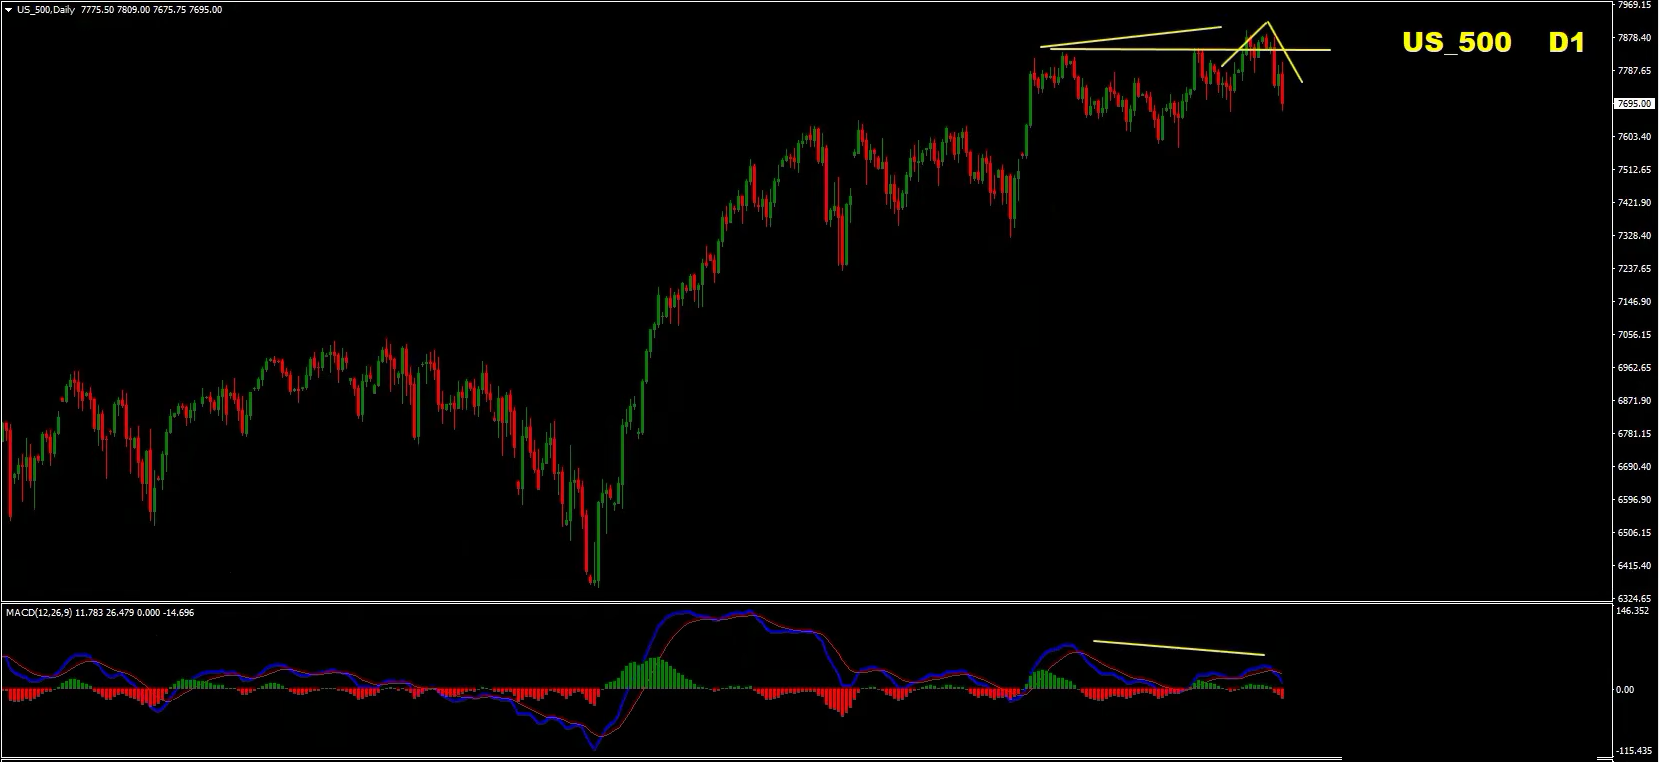
This behavior can indicate that the breakout lacks sufficient buying strength.
If the market continues to form lower highs and breaks relevant support, the bearish scenario would gain further confirmation.
Four-Hour Chart: Lower Highs and Lower Lows
The four-hour chart is showing lower highs and lower lows, suggesting that bearish momentum has become more prominent.
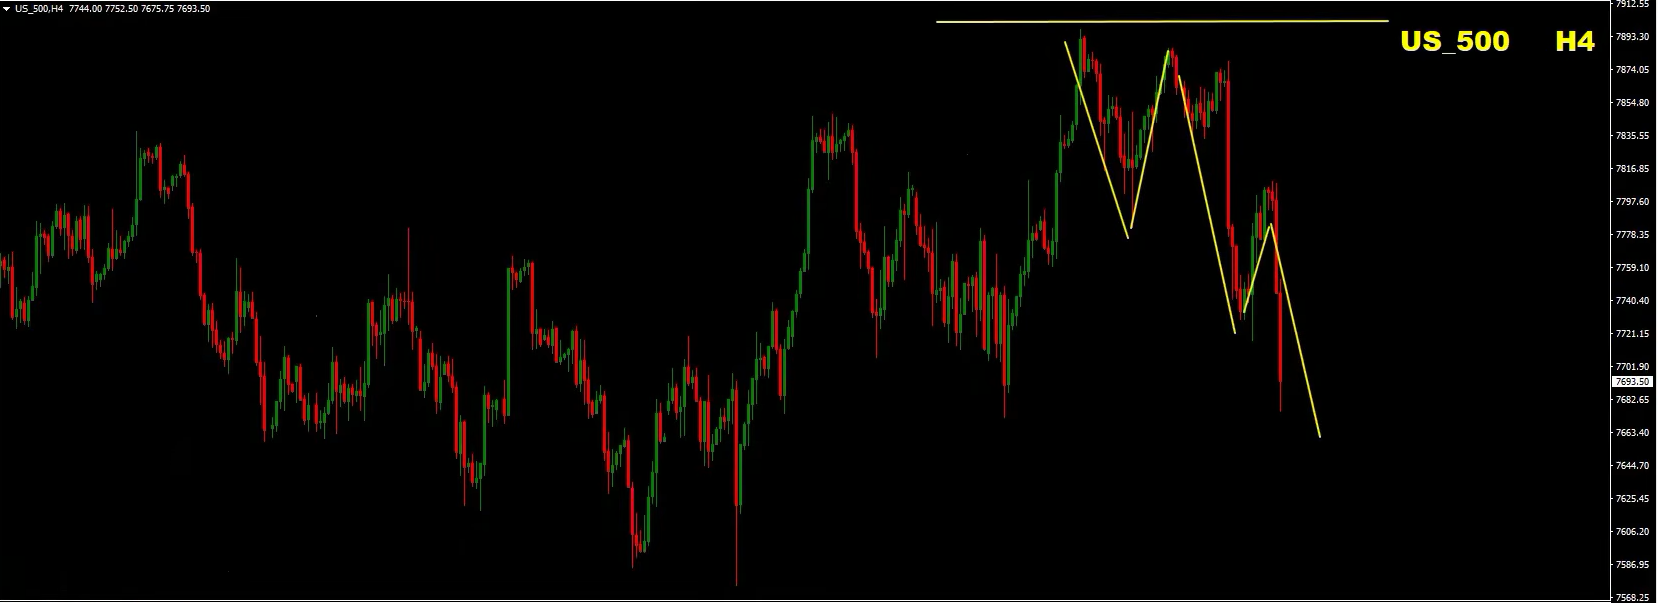
The trading plan is to monitor rallies toward the following technical areas:
- Broken support that may now act as resistance.
- Previous highs that form supply zones.
- The descending resistance line.
- The most recent significant high, which is important for invalidating the bearish structure.
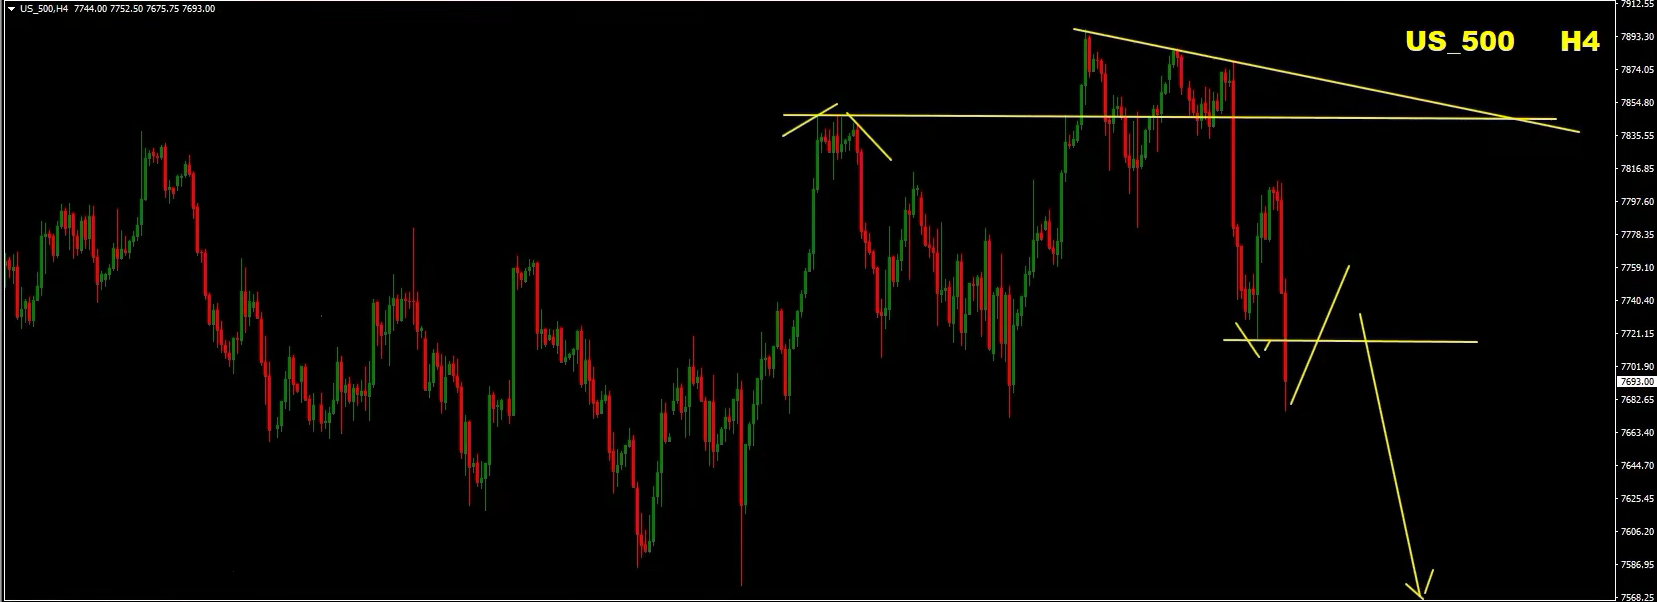
As long as these resistance areas hold, a recovery could provide an opportunity to look for a new bearish setup.
Fundamental Risks to Monitor
The S&P 500 outlook is not determined by technical analysis alone.
Inflation trends, interest-rate expectations, geopolitical developments and uncertainty surrounding the US political calendar could all influence market sentiment and volatility.
These factors may support a bearish move, but they can also trigger sharp countertrend rallies. Traders should therefore avoid assuming that a technical setup will play out without interruption.
S&P 500 trading outlook: Bearish while the key resistance zone and recent high remain intact. We prefer to wait for a rally and bearish confirmation rather than chase a decline.
Final Thoughts: Sell the Rallies, but Wait for Confirmation
This week’s analysis highlights potential bearish opportunities in EUR/USD, EUR/GBP, USD/JPY, Gold and the S&P 500.
Across these markets, we are watching broken support levels, supply zones, bearish divergence and developing lower highs and lower lows. These structures suggest that selling rallies may offer interesting opportunities if the market confirms the expected direction.
At the same time, the presence of bullish divergence on some shorter timeframes means that corrective recoveries remain possible. Traders should distinguish between a temporary bounce and a genuine trend reversal rather than assuming that every rally must fail.
My preferred approach is to remain patient, allow price to reach the relevant technical areas and look for confirmation before entering.
Remember: a trading plan is not a prediction that must come true. It is a framework for identifying opportunities, managing risk and responding when the market confirms or invalidates our expectations.
What do you think about this week’s trading opportunities? Do you agree with the bearish outlook on these markets, or do you see a potential reversal developing?
Share your thoughts in the comments below.
 Join the Home Trader Club
Want to access the tools, systems, and real-time education we use daily?
With AvaTrade Broker’s support, you can now enjoy up to one full year of access to the Home Trader Club — including:
-
All professional trading systems
-
Access to our new project, the Home Trader Club trade copier, where our traders trade and you can copy.
-
Real-time trade ideas and setups
-
Full access to our course library and trading marketplace
 Join here: https://tracking.avapartner.com/dR0AAA
Wishing you a profitable week ahead!
Vladimir Ribakov
Internationally Certified Financial Technician
Home Trader Club
Risk Disclaimer
Trading Forex, CFDs, cryptocurrencies, Gold and other financial instruments involves substantial risk and may not be suitable for every trader. Technical analysis and market forecasts represent opinions and scenarios, not guarantees of future performance. Always conduct your own analysis, use appropriate risk management and never trade with money you cannot afford to lose.