


Hi Traders! EURNZD technical analysis and short term forecast post is here. We do our analysis on the MetaTrader4 platform (MT4), some very interesting, useful tips and hacks about the MT4 platform could be found here. As we do in every technical analysis post we are going to perform the multi-timeframe technical analysis on this pair in order to find possible trading opportunities. If you would like to learn more about the way we trade and the technical analysis we use then check out the Traders Academy Club Spoiler alert – free memberships are available! Let’s start our analysis now from the highest timeframe which will be the daily chart here.
EURNZD D1(Daily) Chart Analysis – Heikin Ashi Candles, Higher Highs, ADX Indicator
On the daily chart, we have a bullish rally and currently it looks like this bullish rally is about to continue itself. Based on the Heikin Ashi candles we can see that currently, we have strong bullish bodies in upward moving market conditions so it basically reflects a bullish environment. In addition to this, we could see that the price which was moving higher has created higher highs based on the MACD indicator, which is a sign of gaining momentum towards the bullish side. Also, the ADX indicator gave a bullish signal here at the cross of +DI (green line) versus -DI (red line) and the main signal line (silver line) reads value over 25, we may consider this as another evidence of bullish pressure. In addition to this, currently there are no signs opposing this bullish view. So everything looks good here for the bulls and we may now move down to lower timeframe and look for evidences supporting this short term bullish view.

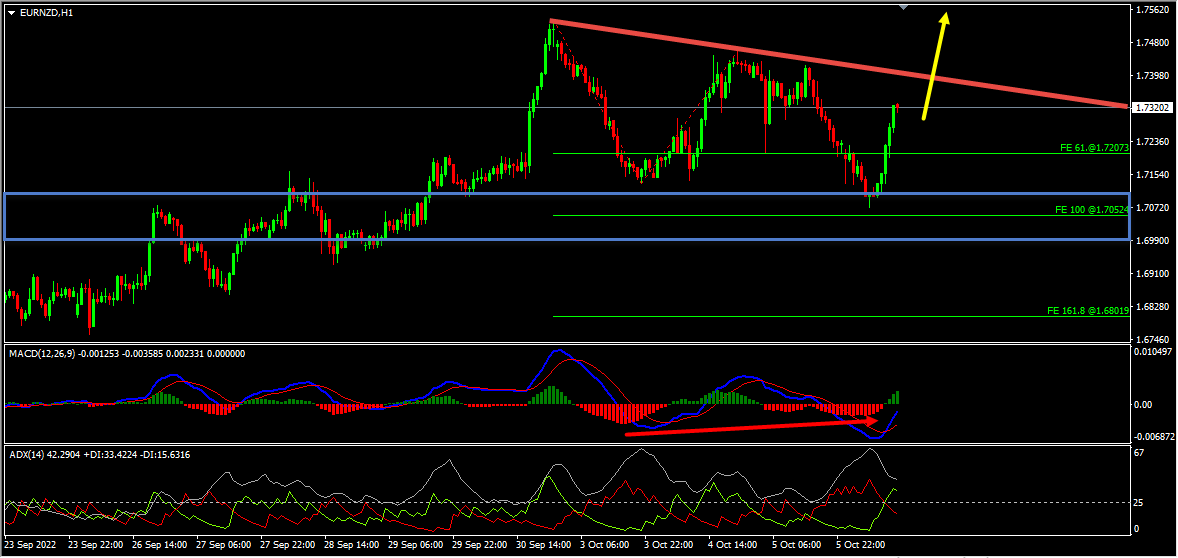
EURNZD H1(1 Hour) Chart Analysis – Key Support Zone, Bullish Divergence, ADX Indicator
Looking at the H1 chart, currently it looks like a potential double wave correction is happening, Also, we have a key support zone that has formed based on the 100%(1.75024) Fibonacci expansion level of the first wave. The price which was moving lower, reached this key support zone, respected it and is currently bouncing higher from this zone. Also, we have a bullish divergence that has formed between the first low that has formed at 1.71326 and the second low that has formed at 1.70716 based on the histogram of the MACD indicator which we may consider as evidence of bullish pressure. In addition to this, the ADX indicator gave a bullish signal here as well at the cross of +DI (green line) versus -DI (red line) and the main signal line (silver line) reads value over 25, we may consider this as yet another evidence of bullish pressure. So based on all this, until the key support zone holds my short term view remains bullish here. A valid breakout above the most recent downtrend line would be the validation for this bullish view.
Technical Analysis & Forecast Summary
EURNZD D1(Daily) Chart Analysis
- Heikin Ashi Candles, Higher Highs, ADX Indicator
EURNZD H1(1 Hour) Chart Analysis
- Key Support Zone, Bullish Divergence, ADX Indicator
Trading Tips
It is always recommended to look for confirmations before you jump into any trade. If you are not sure about how to trade this short term buy setup then you can use any setup and strategy that you have in your arsenal to look for bullish moves and join this buy trade.
Also, don’t forget to protect your buy trade using a stop loss and make sure to set a target and keep a proper risk/reward ratio.
You will also find a pretty extensive database of educational materials here in the blog – just use the search or check out the Forex Education section above.
Not sure how to enter a trade? Spot reversals (bounces)? Not sure how to spot breakouts?
I invite you to
And improve your trading with us.
Also, you can get one of our strategies free of charge. You will find all the details here
If you have any further questions, don’t hesitate to drop a comment below!
Happy Trading!
Arvinth Akash
Traders Academy Club Team


....)