


Hi Traders! NZDCAD forecast follow up and update is here. On July 8th I shared this “Technical Analysis – NZDCAD Forecast” post in our blog. In this post, let’s do a recap of this setup and see how it has developed now. If you would like to learn more about the way we trade and the technical analysis we use then check out the Traders Academy Club. Spoiler alert – free memberships are available!
My Idea
On the H4 chart, we have a bullish divergence that has formed between the first low that has formed at 0.86305 and the second low that has formed at 0.85990 based on the MACD indicator. Then the price moved higher and broke above the high at 0.87484 creating higher highs, thus forming a classical setup of bullish divergence followed by bullish convergence. Hence as per the book scenario, after a bullish convergence, we may look for corrections to happen and then further continuation to the upside. Also we could see that the price which is moving higher has created a bullish trend pattern in the form of three higher highs, higher lows, we may consider this as evidence of bullish pressure. Generally, after a bullish trend pattern, we may expect corrections and then potential continuation higher. Currently, it looks like a correction is happening and until the strong support zone shown in the image below(marked in blue) holds my view remains bullish here and I expect the price to move higher further. Alternatively if the price moves lower and if we get a valid breakout below the low at 0.85990 then this bullish view will be invalidated.

NZDCAD H4(4 Hours) Chart Current Scenario
Based on the above-mentioned analysis my view was bullish here and I was expecting the price to move higher further until the strong support zone holds. The price action followed my analysis here exactly as I expected it to. After the bullish trend pattern, we had a pullback and the price which was moving lower reached the strong support zone, respected it and bounced higher from this zone. We also had a bullish hidden divergence that has formed between the first low that has formed at 0.86293 and the second low that has formed at 0.86881 followed by a continuing bullish divergence which we may consider as facts provided by the market supporting the bullish view. The price then moved higher and delivered 130+ pips move so far.
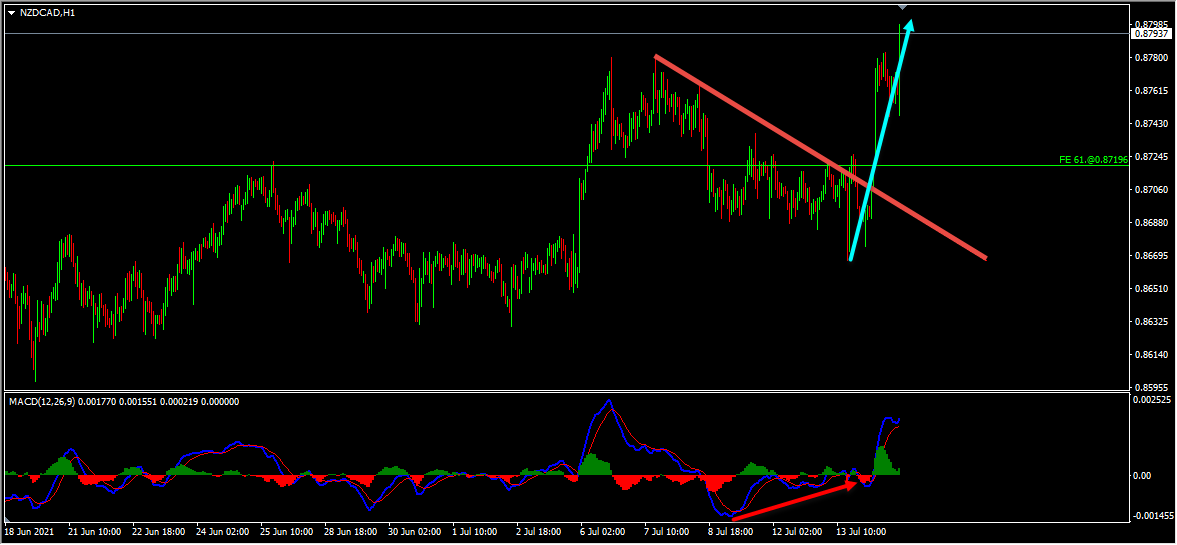
 On the H1 chart, the market provided us with various facts supporting the bullish view. The price which was moving lower created a bullish divergence between the first low that has formed at 0.86881 and the second low that has formed at 0.86666 based on the MACD indicator. The price then moved higher and broke above the most recent downtrend line, we may consider these as facts provided by the market supporting the bullish view. Then as you can see in the image below how the price moved higher after that and provided a fantastic move to the upside.
(Note: You can learn about a Killer Forex Strategy “Double Trend Line Principle” here)
 As traders we always have two choices, the first one is to fall in love with our analysis and try to convince the market and expect the price to move in the direction as per our wish. The second one is to follow the facts that the market provides us and make the right actions according to that. As you know the first option won’t help us and as you can see in the example above what happened when we followed the facts that the market hinted us and took the right action according to that.
For similar trade ideas and much more I invite you to
Also, you can get one of our strategies free of charge. You will find all the details here
If you have any further questions, don’t hesitate to drop a comment below!
To your success,
Vladimir Ribakov
Certified Financial Technician


