


Hi Traders! USDCHF forecast and technical analysis is here. We do our analysis on the MetaTrader4 platform (MT4). Some very interesting and useful tips and hacks about the MT4 platform could be found here. If you would like to learn more about the way we trade and the technical analysis we use then check out the Traders Academy Club Spoiler alert – free memberships are available!
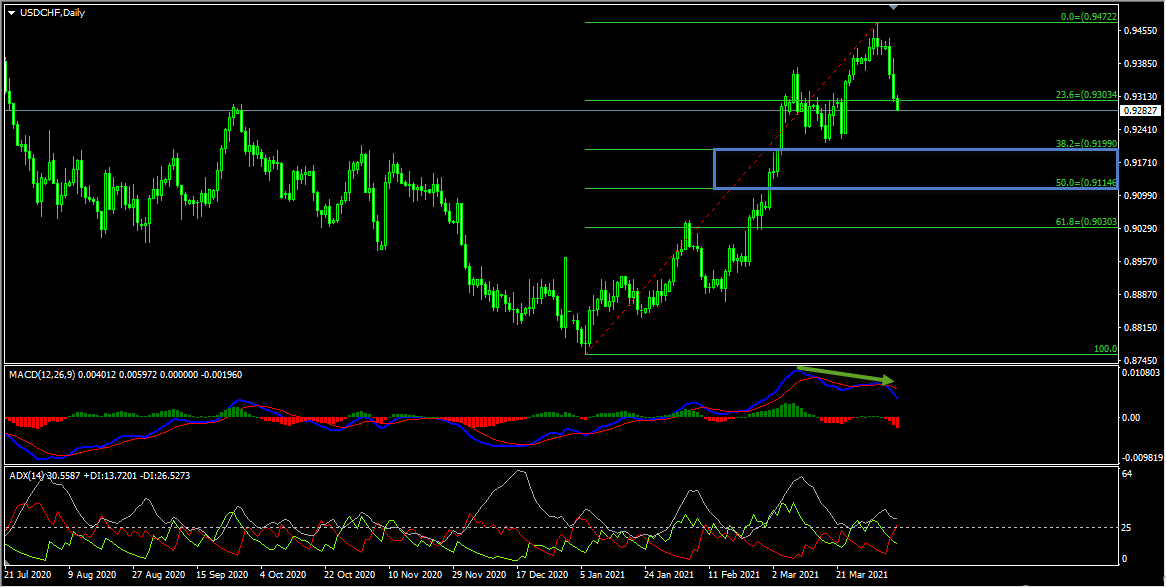
USDCHF D1(Daily) Chart Analysis – Bearish Divergence, Key Support Zone, ADX Indicator
On the daily chart we had a bullish rally, currently it looks like this bullish rally has completed itself and a correction is happening. Generally, after a bullish rally we may expect corrections towards the 38.2% – 50% Fibonacci retracement zones and then potential continuation higher. We also had a bearish divergence that has formed between the first high that has formed on 9th March 2021 and the second high that has formed on 1st April 2021 based on the MACD indicator which we may consider as evidence of bearish pressure. Currently, it looks like the correction that we are looking for is happening. We could see that the price still has room lower towards the key support zone formed by the 38.2%(0.91990) – 50%(0.91148) Fibonacci retracement zones of this bullish rally. In addition to this the ADX indicator gave bearish signal at the cross of -DI (red line) versus +DI (green line) and the main signal line (silver line) reads value over 25 which we may consider as another evidence of bearish pressure. We may now move down to one lower timeframe and see if we can find evidences supporting this bearish view.
USDCHF H4(4 Hours) Chart Analysis – Bearish Convergence, ADX Indicator
On the H4 chart, the price has created a bearish divergence between the first high that has formed at 0.94167 and the second high that has formed at 0.94722 based on the MACD indicator. The price then moved lower and broke below the low at 0.93696 creating lower lows, thus forming a classical setup of bearish divergence followed by bearish convergence. Hence as per the book scenario, after a bearish convergence, we may look for possible corrections and then further continuation to the downside. Also, the ADX indicator gave bearish signal here as well at the cross of -DI (red line) versus +DI (green line) and the main signal line (silver line) reads value over 25 which we may consider as another evidence of bearish pressure. So the bottom line here is that the H4 chart has evidences supporting the bearish view. We may now move down to one more timeframe lower and see if we can find evidences supporting this bearish view.

USDCHF H1(1 Hour) Chart Analysis – Bearish Trend Pattern, ADX Indicator
On the H1 chart, the price which is moving lower has created a bearish trend pattern in the form of three lower highs, lower lows which we may consider as evidence of bearish pressure. Generally, after a bearish trend pattern, we may expect corrections and then further continuation lower. In addition to this, the ADX indicator gave bearish signal here as well at the cross of -DI (red line) versus +DI (green line) and the main signal line (silver line) reads value over 25 which we may consider as yet another evidence of bearish pressure. So based on all this my view here is bearish and I expect the price to move lower further after pullbacks.

Technical Analysis & Forecast Summary
USDCHF D1(Daily) Chart Analysis
- Bearish Divergence, Key Support Zone, ADX Indicator
USDCHF H4(4 Hours) Chart Analysis
- Bearish Convergence, ADX Indicator
USDCHF H1(1 Hour) Chart Analysis
- Bearish Trend Pattern, ADX Indicator
Trading Tips
It is always recommended to look for confirmations before you jump into any trade. If you are not sure about how to trade this sell setup then you can use any setup and strategy that you have in your arsenal to look for bearish moves and join this sell trade.
Also don’t forget to protect your sell trade using a stop loss and make sure to set a target and keep a proper risk/reward ratio.
You will also find a pretty extensive database of educational materials here in the blog – just use the search or check out the Forex Education section above.
Not sure how to enter a trade? Spot reversals (bounces)? Not sure how to spot breakouts?
I invite you to join us in our live market analysis, on daily basis, and improve your trading with us.
Also, you can get one of our strategies free of charge. You will find all the details here
If you have any further questions, don’t hesitate to drop a comment below!
To your success,
Vladimir Ribakov
Certified Financial Technician


.....)