In this article, I’ll share with you my analysis on EURUSD and Oil.
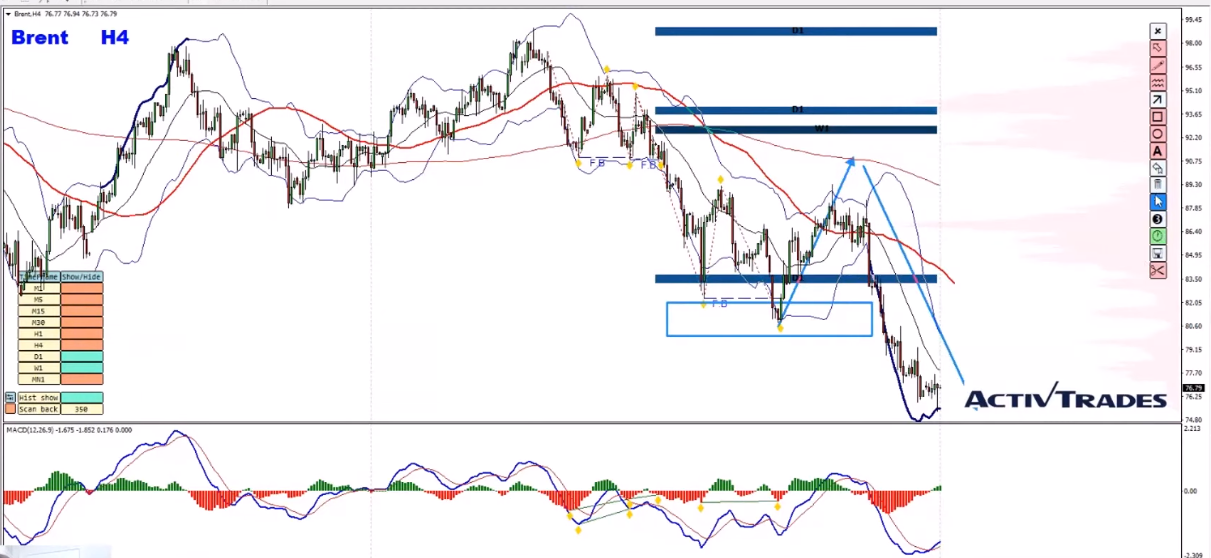
OIL– Oil is moving in a clear bearish trend despite the inflation that keeps breaking records. I believe there is more to come and that the sellers didn’t finish their job yet. Selling the rallies is my trading plan.
EURUSD – EURUSD bounced 1000 pips since the low it created earlier this year. I believe this bullish party is coming to an end soon, and I expect to see bearish corrections soon.
A detailed analysis of these instruments are as follows.
You can watch the video explanation of this forecast here:
Oil
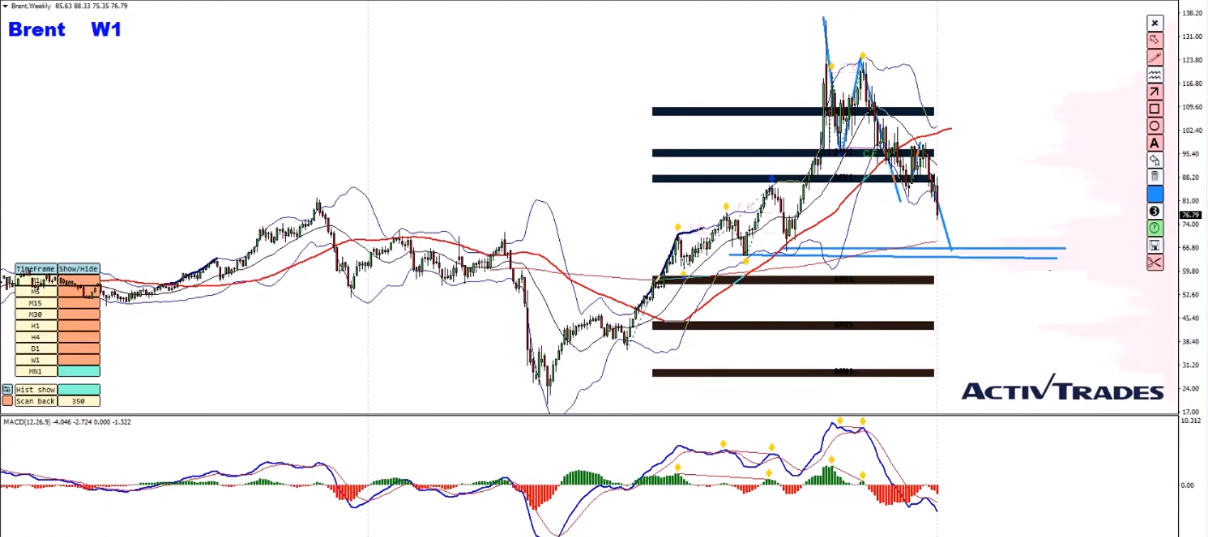
On the weekly forecast I shared with you two weeks ago, I mentioned, “I wanted to see a potential bounce from a key zone and then a further continuation lower.” The price action follows this scenario so far.
Weekly timeframe – The price followed our trading plan, and after bouncing off the 80-81 area, the Oil price has gone further down. I believe that we have a developing cycle in Oil which should take us to the next key zone formed by the previous lows, which coincides with the key volume zone based on my volume profile Key Trading Levels Indicator. See the image below –
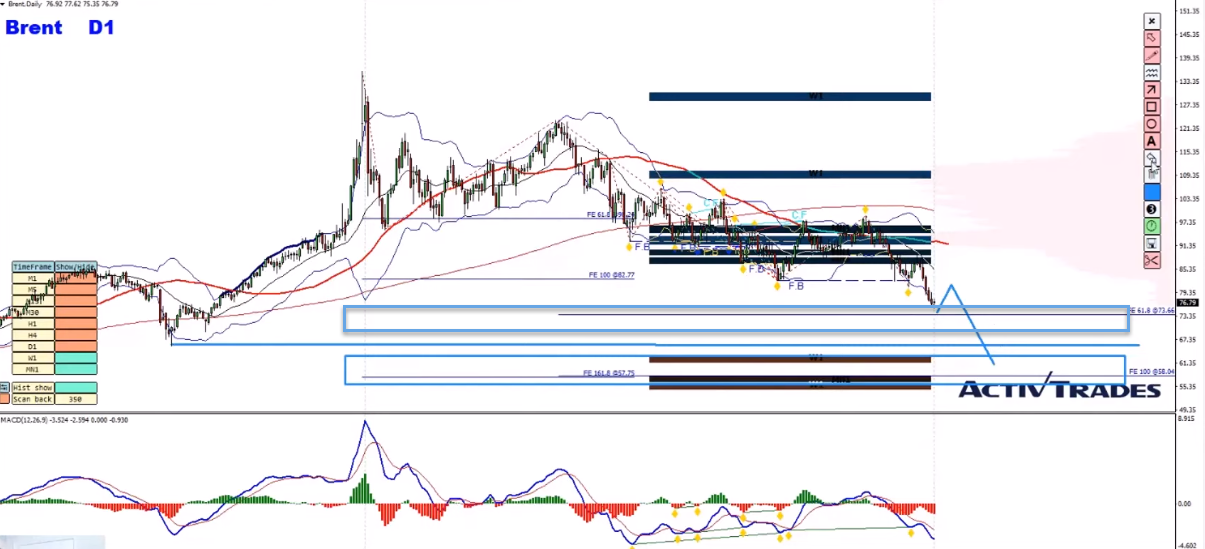
Daily timeframe – On the daily chart, plotting the Fibonacci expansion on the ongoing waves, we have two key zones that I would be paying attention to. The first area is the 61.8% Fibonacci expansion levels of the last two waves. The next massive level for the long run would be the 100% Fibonacci expansion levels of the two waves. This second key zone is next to weekly and daily volume zones and the demand area from the weekly chart shown above.
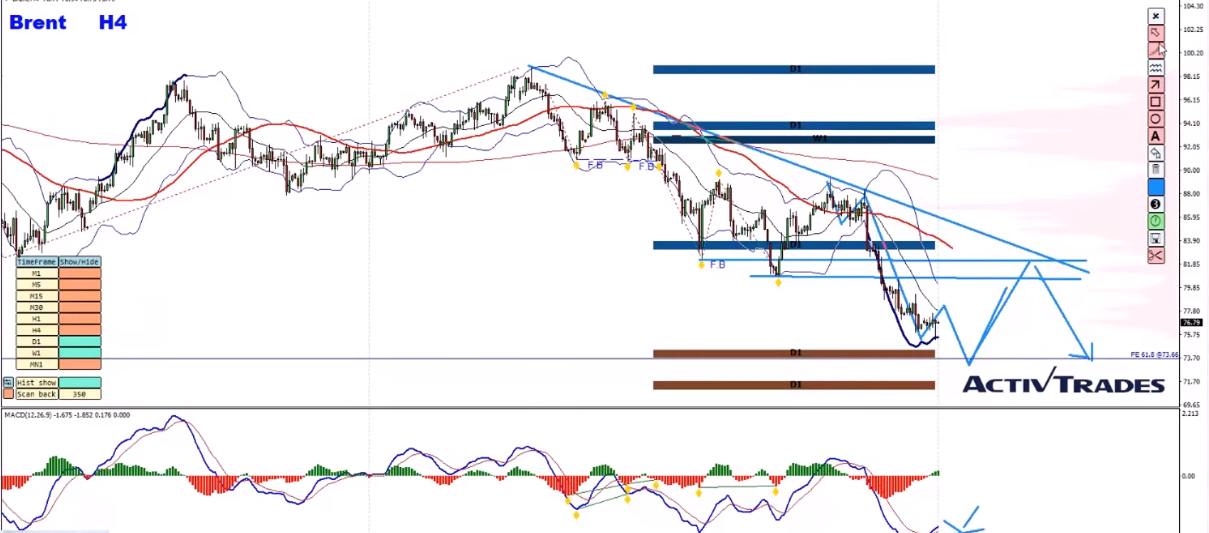
H4 timeframe – On the H4 chart, we can see the ongoing bearish trending structure; there are no ending signs at the moment. That makes me think there should be at least one final push toward the first daily key support zone until a bullish divergence blocks the price. I may expect a potential correction toward the resistance zone shown in the image below, where the falling resistance line coincides. If this rally takes place, then in my point of view, it would be a fantastic opportunity to look for sell towards the daily key support zones mentioned above.
EURUSD
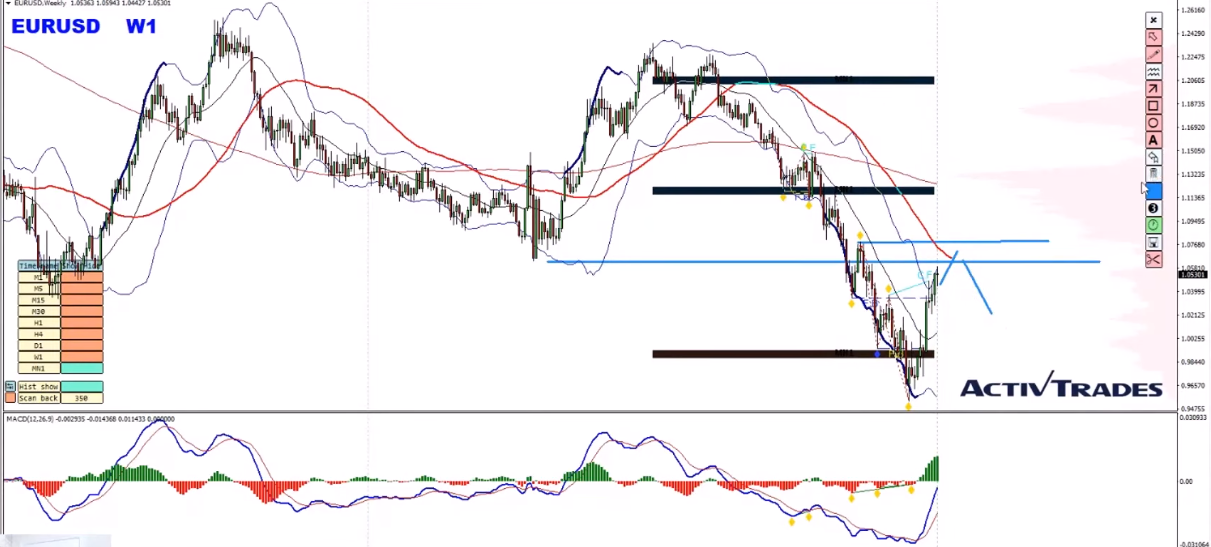
Weekly timeframe – On the weekly chart, the price bounces back right from the bottom, and I believe the pair is under a corrective bullish phase. The price is approaching a key resistance area, and I think when the price enters this area, there is an excellent chance that it might reverse and move down.
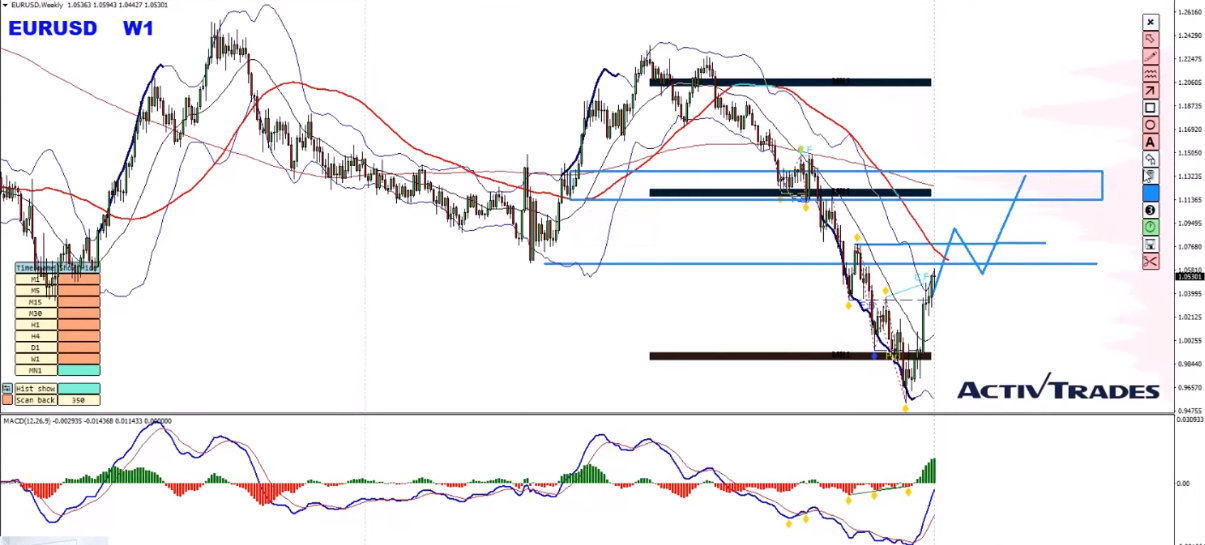
The alternative scenario here is that if the price breaks above the key resistance zone, then this area turns into a support zone. If that happens, then after a pullback, I may expect the price to move higher all the way toward the next key resistance zone around the 1.11 – 1.12 area or even higher.
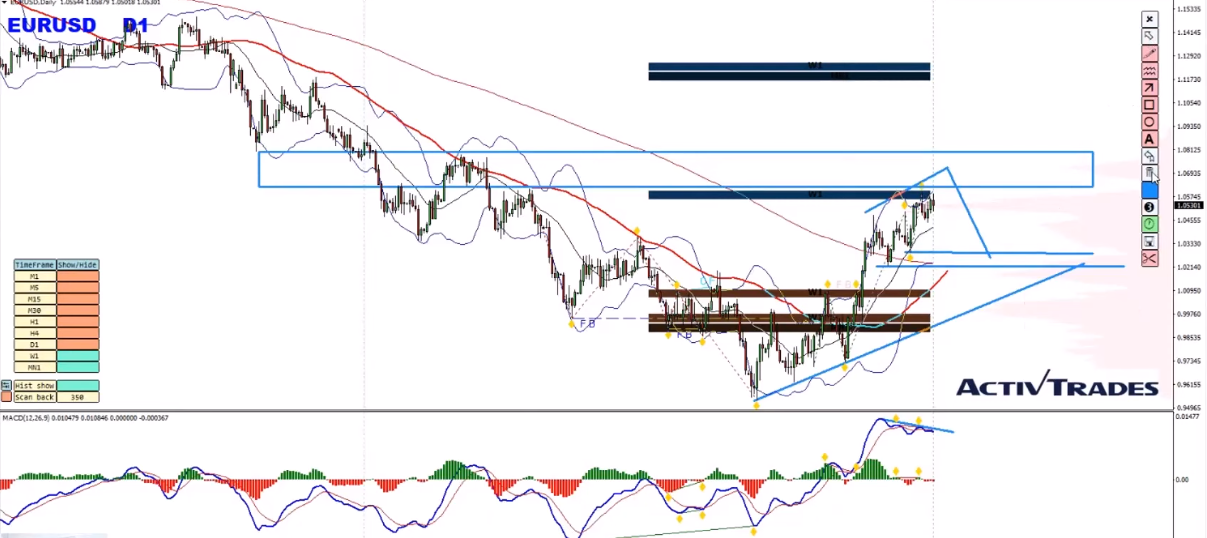
Daily timeframe – In my point of view, the first scenario that I mentioned above has a slighter edge over the second one because we can see that the price is nearing the weekly resistance zone. We have a moving average bearish divergence that is developing on the MACD indicator and the RSI indicator starts to build the same
That would be all for this weekly forecast. I wish you a successful trading week ahead.
Our recommended CFD broker – ActivTrades
If you have any further questions, don’t hesitate to drop a comment below!
Yours to your success,
Vladimir Ribakov
Certified Financial Technician


