


Hi Traders! Weekly summary and review November 5th, 2021 is here. It is now time to recap and summarize the trade setups that we had during this week. Below you will find the short explanation of all the trade setups we had this week and how it has currently developed now.
Trading Ideas (Blog Posts)
GBPAUD – My idea here was “On the H1 chart, the price which was moving lower has reached a strong support zone, respected it and bounced higher from this zone. Also, we had a bullish divergence that has formed between the first low that has formed at 1.81849 and the second low that has formed at 1.81262 based on the MACD indicator. Then the price moved higher and broke above the last high at 1.82373 creating higher highs, thus forming a classical setup of bullish divergence followed by bullish convergence. Hence as per the book scenario, after a bullish convergence, we may look for corrections to happen and then further continuation to the upside. Currently it looks like a correction is happening. In addition to this, the ADX indicator gave a bullish signal here at the cross of +DI (green line) versus -DI (red line) and the main signal line (silver line) reads value over 25, we may consider this as yet another evidence of bullish pressure. So everything looks good here for the bulls and until the strong support zone shown in the image below holds, I expect the price to move higher further after pullbacks”.
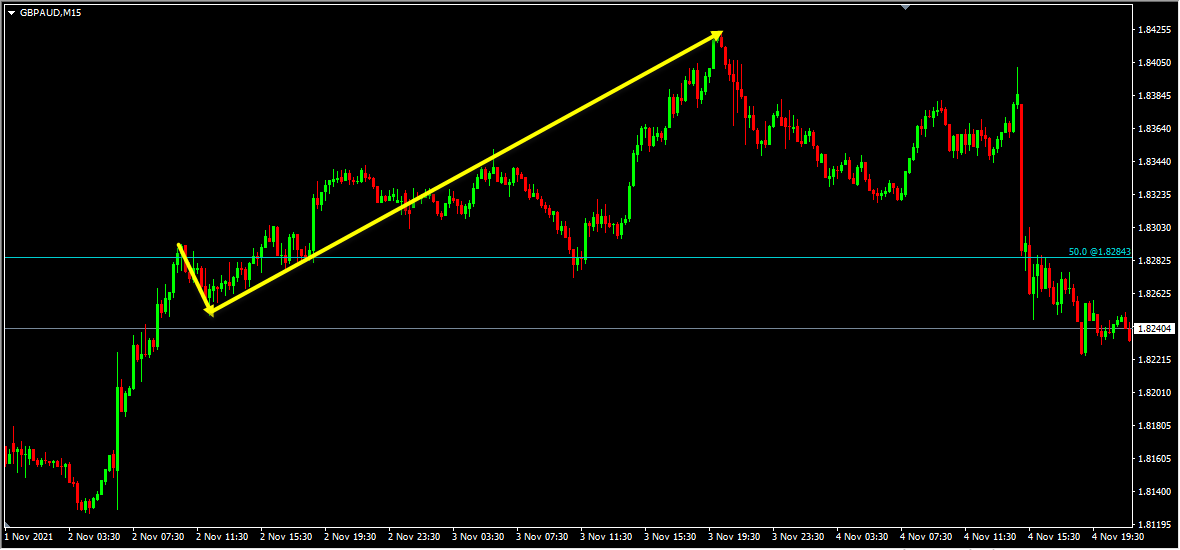
 Current Scenario – Based on the above-mentioned analysis my short-term view was bullish here and I was expecting the price to move higher further. After the bullish convergence, the pullback that I was looking for happened, and then the price moved higher further and provided a fantastic move to the upside delivering 160+ pips move!
 You can see this move clearly on the M15 chart below.
EURJPY – My idea here was “On the H4 chart, based on the Heikin Ashi candles we can see that currently, we have strong bullish bodies here as well in upward moving market conditions so it basically reflects a bullish environment. Also, the price which was moving lower has created a bullish divergence that has formed between the first low that has formed at 132.257 and the second low that has formed at 131.474 based on the MACD indicator which we may consider as evidence of bullish pressure. We also had two strong resistance zones that has formed and the price which was moving higher has broken above these zones and is holding above them. After the breakout these strong resistance zones are acting as two strong support zones for us. Until both these strong support zones shown in the image below hold my view remains bullish here. If we get a valid breakout above the most recent downtrend line we may then consider it as a validation for this bullish view and may expect the price to move higher further”.
 Current Scenario – The validation for the bullish view which is a valid breakout above the downtrend line didn’t happen yet. Price is currently holding in the first strong support zone, until both the strong support zones hold my view remains bullish here. If we get a valid breakout above the downtrend line we may then consider it as a validation for the bullish view and may expect the price to move higher further.

NZDJPY – My idea here was “On the H4 chart, we could see that currently it looks like a flat correction is happening in the form of a range. While measuring the first and second wave inside this range we have two key support zones that has formed. The first key support zone is formed by the 100%(80.657) Fibonacci expansion level of the first wave, 100%(80.404) Fibonacci expansion level of the second wave and the bottom of the range. The second key support zone is formed by the 161.8%(79.699) Fibonacci expansion level of the first wave and 161.8%(79.506) Fibonacci expansion level of the second wave. Also, based on the Stochastic Oscillator we could see that the price is nearing the extreme which is a good sign favoring the bulls. Until both the key support zones hold my short term view remains bullish here and I expect the price to move higher further”.
 Current Scenario – In this pair my view was bullish and I was expecting the price to move higher further until the two key support zones hold. The price is currently holding in the first key support zone, until both these key support zones hold my bullish view still remains the same here.
 Note: You can follow me here on Trading View and also on my blog to get similar ideas on daily basis)
For similar trade ideas and much more I invite you to join the Traders Academy Club and improve your trading with us.
You will also find a pretty extensive database of educational materials here in the blog – just use the search or check out the Forex Education section above.
If you have any further questions, don’t hesitate to drop a comment below!
To your success,
Vladimir Ribakov
Certified Financial Technician


