


Hi Traders! Weekly Trades Summary February 19th, 2021 is here. It is now time to recap and summarize the trade setups that we had during this week. Below you will find the short explanation of all the trade setups we had in this week and how it has currently developed now.
First, we will see the trade ideas that I shared in my blog:
Trading Ideas (Blog Posts)
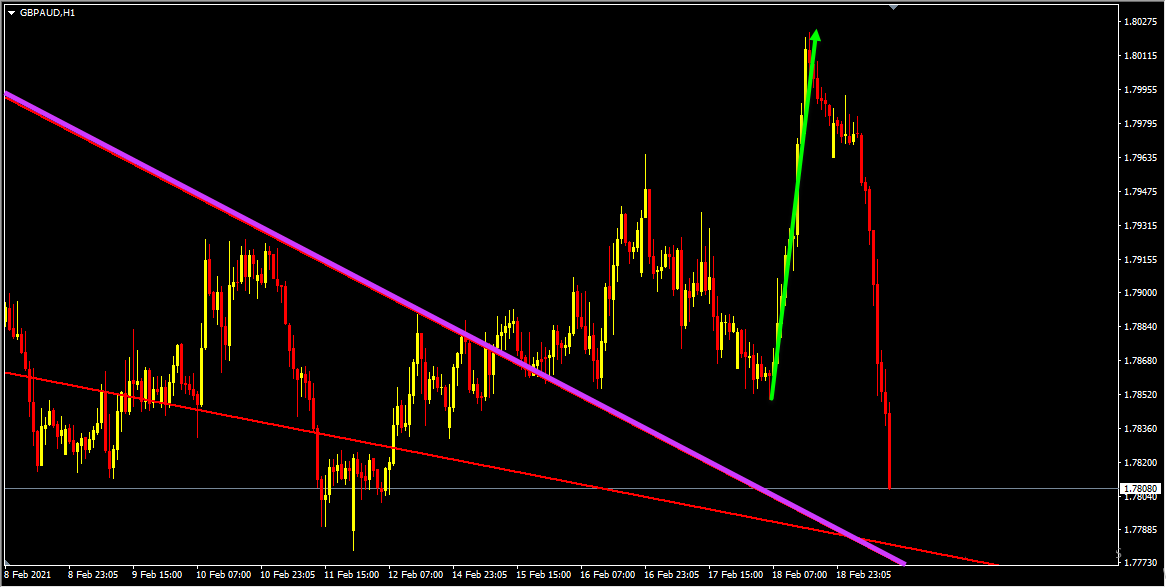
GBPAUD – My idea here was “On the H4 chart, the price which is moving higher has created a bullish trend pattern in the form of three higher highs, higher lows, we may consider this as evidence of bullish pressure. Generally, after a bullish trend pattern, we may expect corrections and then potential continuation higher. After the bullish trend pattern, we had a correction in the form of double wave down with the price reaching a strong support zone, respected it, and is currently bouncing higher from this zone. We also have a bullish divergence that has formed between the first low that has formed at 1.78127 and the second low that has formed at 1.77789 based on the MACD indicator which we may consider as evidence of bullish pressure. In addition to this, the price which is moving higher has broken above the most recent downtrend line, we may consider this as another evidence of bullish pressure. So everything looks good here for the bulls and until this strong support zone shown in the image below holds I expect the price to continue higher further”.
 Current Scenario – On the H4 chart, my view was bullish and I was expecting the price to move higher further until the strong support zone holds. After the breakout of the most recent downtrend line, we had a pullback but the price was holding above the strong support zone. The price then moved higher further as I expected and delivered 180+ pips move before the price moved lower.
You can find a detailed explanation regarding this here: GBPAUD Forecast Update And Follow Up
 You can see this move clearly on the H1 chart below.
USDCHF – My idea here was “On the H4 chart, the price has created a bullish divergence between the first low that has formed at 0.88897 and the second low that has formed at 0.88706 based on the MACD indicator. Then the price moved higher and broke above the high at 0.89391 creating higher highs, thus forming a classical setup of bullish divergence followed by bullish convergence. Hence as per the book scenario, after a bullish convergence, we may look for corrections to happen and then further continuation to the upside. Also, the price which is moving higher has broken above the most recent downtrend line which we may consider as another evidence of bullish pressure. So everything looks good here for the bulls and until the strong support zone shown in the screenshot below (marked in blue) holds my view remains bullish here”.
 Current Scenario – On the H4 chart after the bullish convergence currently it looks like a pullback is happening. Until the strong support zone (marked in blue) holds my view remains bullish here and I expect the price to move higher further after pullbacks.

CADCHF – My idea here was “On the H4 chart, we have a key resistance zone that has formed based on the 61.8%(0.70860) Fibonacci expansion level of the big wave, and the 100%(0.70817) and 161.8%(0.71205) Fibonacci expansion levels of the small wave we have. The price which is moving higher has currently reached this zone. We also have a bearish divergence that has formed between the first high that has formed on 2nd February 2021 and the second high that has formed on 17th February 2021 based on the MACD indicator which we may consider as evidence of bearish pressure. Also based on the Stochastic Oscillator we could see that the price has reached its extreme here as well which we may consider as evidence of bearish pressure. We also have a good uptrend line that has formed, if we get a valid breakout below this dynamic support we may consider it as a validation for the bearish view and we may then expect the price to continue lower further”.
 Current Scenario – In this pair, the validation for the bearish view which is a valid breakout below the most recent uptrend line didn’t happen yet. Until the key resistance zone holds my plan still remains the same here.

Trading Ideas (Trading View Posts)
NZDCAD – My idea here was as follows:
 Current Scenario – In this pair, the price action followed my analysis exactly as I expected it to. The price respected the strong support zone and bounced higher from this zone delivering around 100 pips move so far.
 You can see this move clearly on the H1 chart below.

Crude Oil – My idea here was as follows:
 Current Scenario – My plan remains unchanged here, that is until the strong support zone holds my view remains bullish and I expect the price to move higher further.

CADJPY – My idea here was as follows:
 Current Scenario – The validation for the bullish view which is a valid breakout above the most recent downtrend line happened as I expected. My bullish expectation remains the same here.

Note: You can follow me here on Trading View and also on my blog to get similar ideas on daily basis)
For similar trade ideas and much more join the Traders Academy Club and get access to our complete watch list and trade report.
This is how the report looks like. A table with the hottest market opportunities, screenshot behind every pair and time frame (anything that is in blue inside the table is clickable and leads to a screenshot) + a summary in text format, kind of highlights. And of course Live Market Analysis every single day.

If you have any further questions, don’t hesitate to drop a comment below!
To your success,
Vladimir Ribakov
Certified Financial Technician


