


Hi Traders! CADCHF technical analysis and forecast is here. The way I would like to analyze the chart for setups is based on multi-timeframe confirmations because in my POV if we get more evidences on different timeframes for the same direction then it makes the setup much more reliable. If you would like to learn more about the way we trade and the technical analysis we use then check out the Traders Academy Club Spoiler alert – free memberships are available!
CADCHF W1(Weekly) Chart Analysis – Strong Resistance Zone, Stochastic Oscillator
On the weekly chart we have a strong resistance zone that has formed and the price which is moving higher has currently reached this strong resistance zone and is holding inside it. Until this strong resistance zone holds my view remains bearish here and I expect the price to move lower from this zone. In addition to this based on the Stochastic Oscillator we could see that the price has reached its extreme which we may consider as evidence of bearish pressure. We may now move down to one timeframe lower and see if we can find evidences supporting this bearish view.

CADCHF D1(Daily) Chart Analysis – Potential Bearish Divergence, Volumes Indicator
On the daily chart, we have a potential bearish divergence that is forming between the first high that has formed at 0.74748 and the second high that has formed at 0.74905 based on the MACD indicator. Also based on the Volumes indicator we could see that the volumes are dropping, we may consider these as evidences of bearish pressure. So everything looks good here for the bears and we may now move down to one more timeframe lower and look for evidences supporting the bearish view.

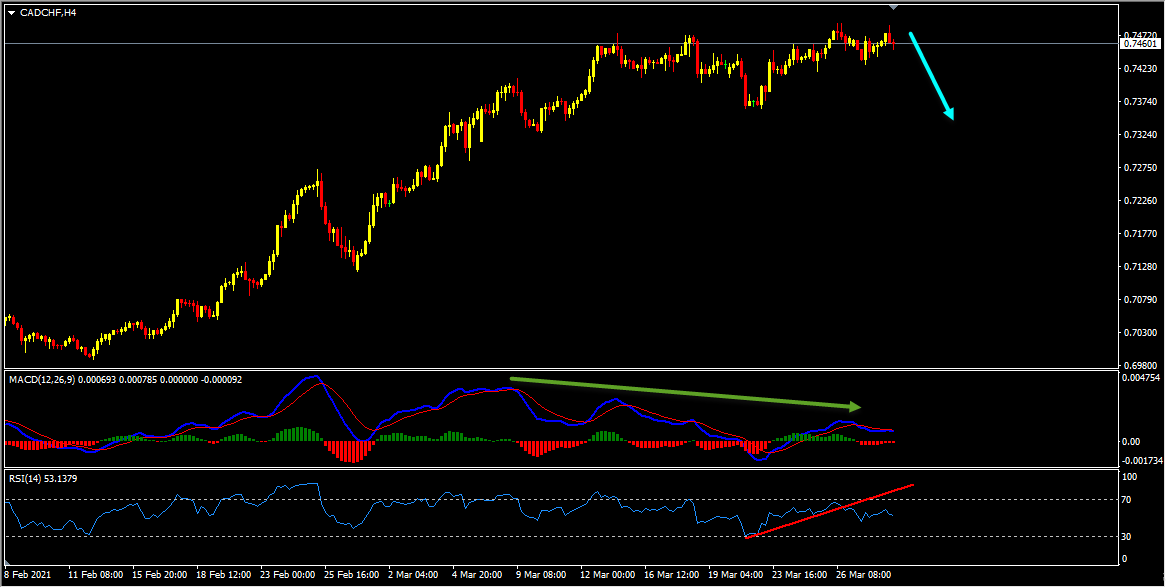
CADCHF H4(4 Hours) Chart Analysis – Bearish Divergence, RSI Indicator
On the H4 chart we have a bearish divergence that has formed between the first high that has formed on 9th March 2021 and the second high that has formed on 26th March 2021 based on the MACD indicator which we may consider as evidence of bearish pressure. Also in addition to this we have an uptrend line breakout based on the RSI indicator which we may consider as another evidence of bearish pressure. So based on all this my view here is bearish and I expect the price to move lower further.
Technical Analysis & Forecast Summary
CADCHF W1(Weekly) Chart Analysis
- Strong Resistance Zone, Stochastic Oscillator
CADCHF D1(Daily) Chart Analysis
- Potential Bearish Divergence, Volumes Indicator
CADCHF H4(4 Hours) Chart Analysis
- Bearish Divergence, RSI Indicator
Trading Tips
It is always recommended to look for confirmations before you jump into any trade. If you are not sure about how to trade this sell setup then you can use any setup and strategy that you have in your arsenal to look for bearish moves and join this sell trade.
Also don’t forget to protect your sell trade using a stop loss and make sure to set a target and keep a proper risk/reward ratio.
You will also find a pretty extensive database of educational materials here in the blog – just use the search or check out the Forex Education section above.
Not sure how to enter a trade? Spot reversals (bounces)? Not sure how to spot breakouts?
I invite you to join us in our live market analysis, on daily basis, and improve your trading with us.
Also, you can get one of our strategies free of charge. You will find all the details here
If you have any further questions, don’t hesitate to drop a comment below!
Happy Trading!
Yordan Kuzmanov
Chief Trader at the Traders Academy Club


