


Hi Traders! Dollar Index forecast update and follow up is here. On September 1st I shared this “Dollar Index Forecast And Technical Analysis” post in our blog. In this post, let’s do a recap of this setup and see how it has developed now. If you would like to learn more about the way we trade and the technical analysis we use then check out the Traders Academy Club. Spoiler alert – free memberships are available!
My Idea
On the H4 chart we have a bearish divergence that has formed between the first high that has formed at 93.167 and the second high that has formed at 93.716 based on the MACD indicator which we may consider as evidence of bearish pressure. Then the price moved lower and broke below the low at 92.439 and has created lower lows based on the moving averages of the MACD indicator which we may consider as a sign of gaining bearish momentum. Until the two strong resistance zones shown in the image below holds my view remains bearish here and I expect the price to move lower further. If the price moves higher further and if we get a valid breakout above the invalidation level shown in the image below then this bearish view will be invalidated.

Dollar Index H4(4 Hours) Chart Current Scenario
Based on the above-mentioned analysis my view was bearish here and I was expecting the price to move lower further until the strong resistance zones hold. The price action followed my analysis exactly as I expected it to here. The price which was moving higher reached the first strong resistance zone, respected it and moved lower from this zone. The price then moved lower further as I expected it to and delivered a nice move to the downside until it was blocked by a bullish divergence.
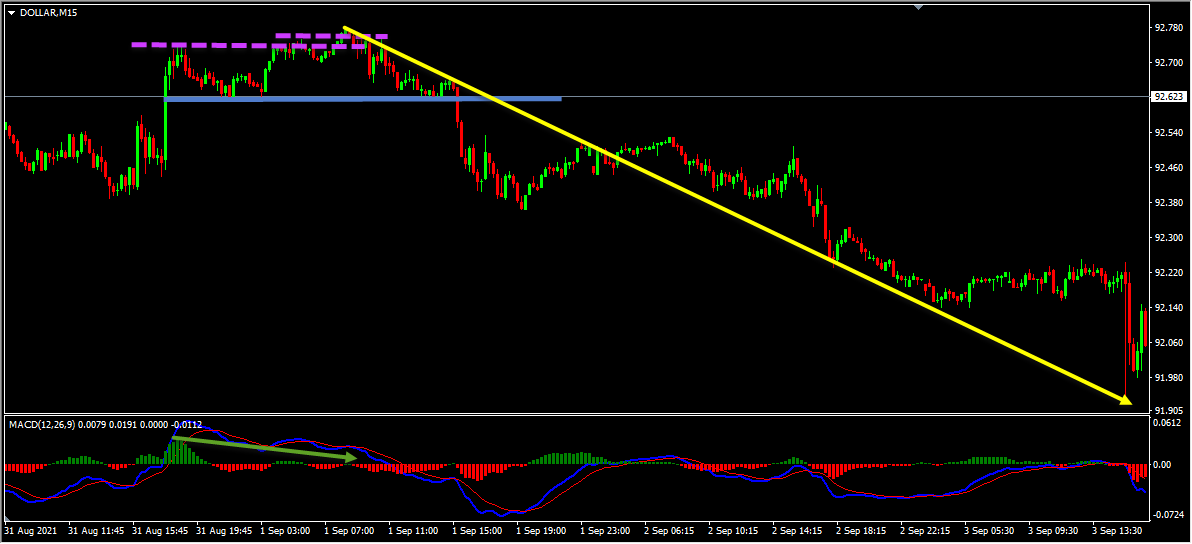
 On the M15 chart, the market provided us with various facts supporting the bearish view. The price which was moving higher created multiple false breaks with a bearish divergence between the first high that has formed at 92.745 and the second high that has formed at 92.778 based on the MACD indicator. The price then moved lower and broke below the last low at 92.618 thus forming lower lows. We may consider these as facts provided by the market supporting the bearish view and also there we no signs opposing this bearish view. Then as you can see in the image below how the price moved lower further and provided a nice move to the downside.
 So, traders, this is why I wanted to show this example to help you understand how important it is to follow the facts. The facts were supporting the bearish view here and there were no signs against it. When the facts do happen as we expected you can see how the price perfectly moved as per the plan. Because these are the kind of hints the market provides us at majority of the times and it’s our obligation as traders to be able to listen to these things that the market tells us and we should try to make the right actions.
Not sure how to enter a trade? Spot reversals (bounces)? Not sure how to spot breakouts?
I invite you to
Also, you can get one of our strategies free of charge. You will find all the details here
If you have any further questions, don’t hesitate to drop a comment below!
Happy Trading!
Arvinth Akash
Traders Academy Club Team.


