


Hi Traders! Dollar Index technical analysis and forecast is here. The way I would like to analyze the chart for setups is based on multi-timeframe confirmations because in my POV if we get more evidences on different timeframes for the same direction then it makes the setup much more reliable. If you would like to learn more about the way we trade and the technical analysis we use then check out the Traders Academy Club Spoiler alert – free memberships are available! Let’s start our analysis from the highest timeframe which will be the daily chart here.
Dollar Index D1(Daily) Chart Analysis – Heikin Ashi Candles, Higher Highs, ADX Indicator
On the daily chart, we have a bullish rally and currently it looks like this bullish rally is about to continue itself as there are no signs of trend change at the moment. Based on the Heikin Ashi candles we can see that currently, we have strong bullish bodies in upward moving market conditions so it basically reflects a bullish environment. Also, we could see that the price which was moving higher has created higher highs based on the MACD indicator which is a sign of gaining momentum towards the bullish side. In addition to this, the ADX indicator gave a bullish signal here at the cross of +DI (green line) versus -DI (red line) and the main signal line (silver line) reads value over 25, we may consider this as another evidence of bullish pressure. So, everything looks good here for the bulls and we may now move down to lower timeframe and look for evidences supporting this bullish view.

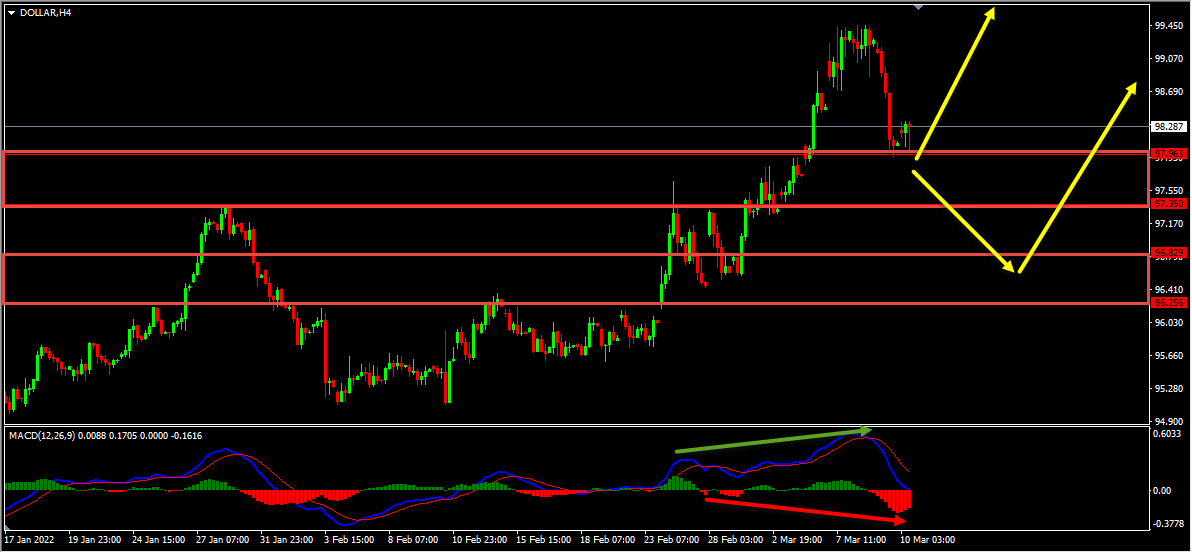
Dollar Index H4(4 Hours) Chart Analysis – Higher Highs, Bullish Hidden Divergence, Two Strong Support Zones
On the H4 chart, we could see that the price which was moving higher has created higher highs here as well based on the MACD indicator, which is a sign of gaining momentum towards the bullish side. Currently, it looks like a pullback is happening with the price creating a bullish hidden divergence that has formed between the first low that has formed at 96.440 and the second low that has formed at 97.765 based on the MACD indicator which we may consider as another evidence of bullish pressure. Also, we had two strong resistance zones that has formed and the price which was moving higher has broken above these zones and is holding above them. After the breakout these strong resistance zones are acting as two strong support zones for us. Until both these strong support zones hold my view remains bullish here and I expect the price to move higher further.
Technical Analysis & Forecast Summary
Dollar Index D1(Daily) Chart Analysis
- Heikin Ashi Candles, Higher Highs, ADX Indicator
Dollar Index H4(4 Hours) Chart Analysis
- Higher Highs, Bullish Hidden Divergence, Two Strong Support Zones
Trading Tips
It is always recommended to look for confirmations before you jump into any trade. If you are not sure about how to trade this buy setup then you can use any setup and strategy that you have in your arsenal to look for bullish moves and join this buy trade.
Also, don’t forget to protect your buy trade using a stop loss and make sure to set a target and keep a proper risk/reward ratio.
You will also find a pretty extensive database of educational materials here in the blog – just use the search or check out the Forex Education section above.
Not sure how to enter a trade? Spot reversals (bounces)? Not sure how to spot breakouts?
I invite you to
And improve your trading with us.
Also, you can get one of our strategies free of charge. You will find all the details here
If you have any further questions, don’t hesitate to drop a comment below!
Happy Trading!
Arvinth Akash
Traders Academy Club Team


