


Hi Traders! GBPJPY short term forecast update and follow up is here. On May 14th 2025 I shared this “GBPJPY Short Term Forecast And Technical Analysis” post in our blog. In this post, let’s do a recap of this setup and see how it has developed now. If you would like to learn more about the way we trade and the technical analysis we use then check out the Home Trader Club. Spoiler alert – free memberships are available!
Explore My Free Mentorship Program
As an Internationally Certified Financial Technician (CFTe, IFTA) and former private capital hedge fund trader, I have successfully mentored numerous students who are now thriving in the trading world. Students who learned with me, are now full-time traders, work in the trading industry, run their own capital firms or are fully funded traders by private companies, develop automated trading solutions and manage others’ capitals. I am a very proud mentor and I am proud of the success stories I’ve helped create, and for a limited time, I’m offering my mentorship program for free through a partnership with Eight Cap broker. Join Eight Cap, become an active trader, and choose the offer that suits you best –

For more details, visit: Home Trader Club Mentorship Program
I’m excited to work with you and help you reach your desired level of success!
My Idea
On the M15 chart, the price which was moving higher created a bearish divergence that has formed between the first high formed at 196.359 and the second high formed at 196.385 based on the MACD indicator which we may consider as evidence of bearish pressure. The price then moved lower and broke below the most recent uptrend line which we may consider as another evidence of bearish pressure. Also, the price which is moving lower has created lower lows based on the MACD indicator which we may consider as yet another evidence of bearish pressure. So everything looks good here for the bears and until the strong resistance zone (marked in red) shown in the image below holds my short term view remains bearish here and I expect the price to move lower further after pullbacks.

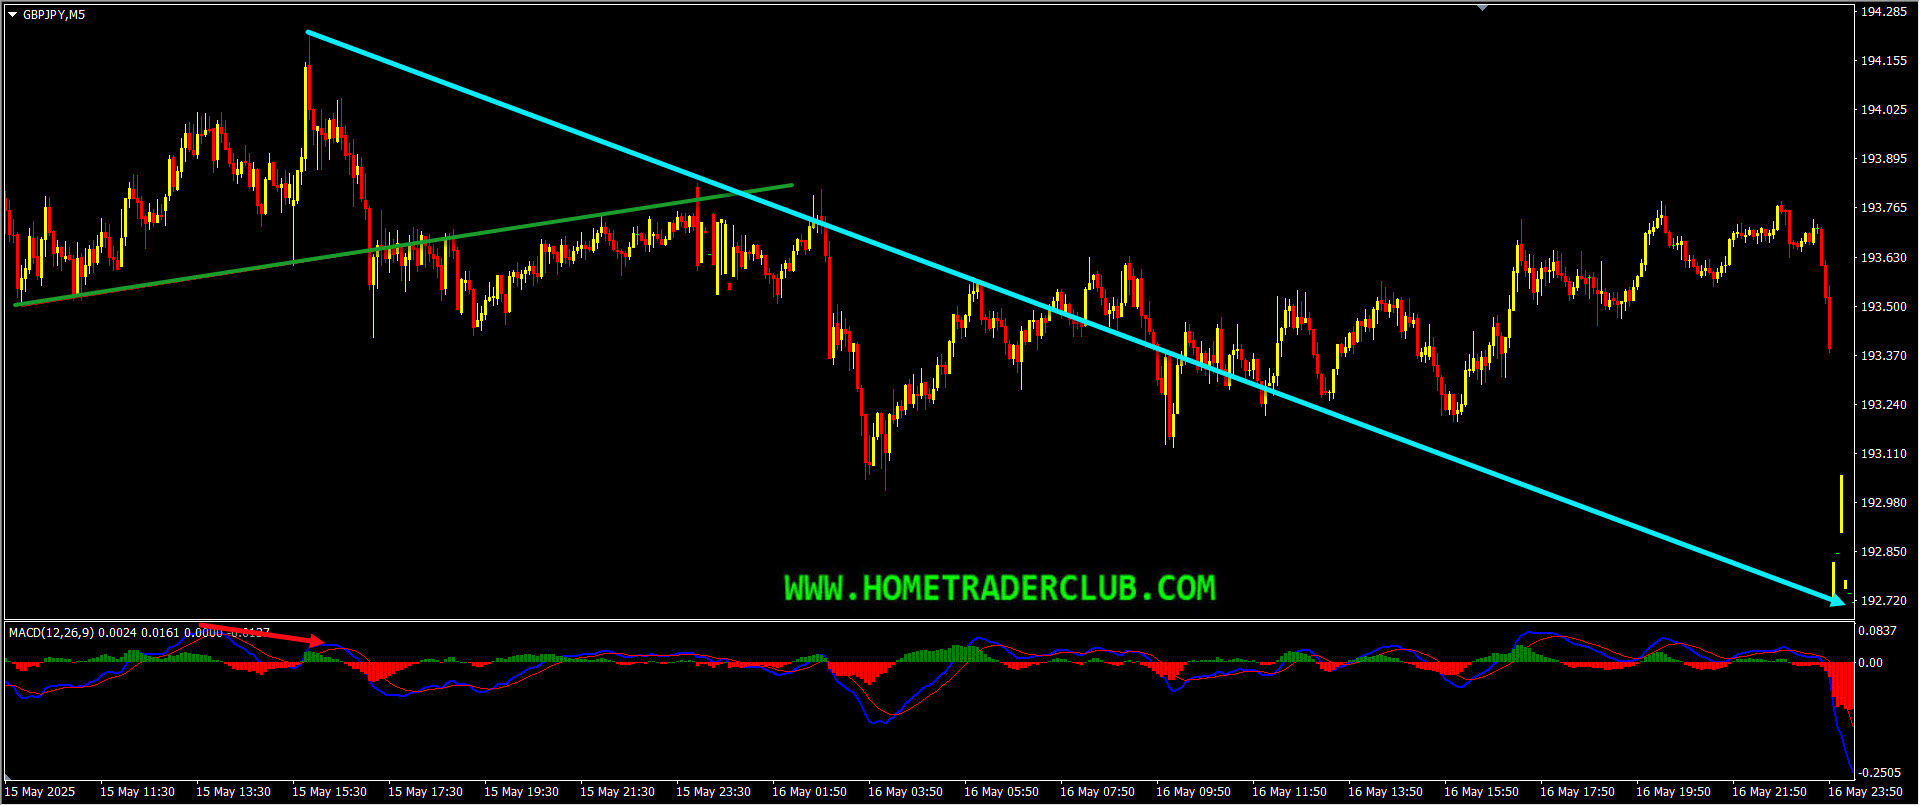
GBPJPY M15(15 Mins) Chart Current Scenario
Based on the above-mentioned analysis, on the M15 chart, my short term view was bearish and I was expecting the price to move lower further until the strong resistance zone holds. The price action followed my analysis exactly as I expected it to here. After the most recent uptrend line breakout, the pullback that I was looking for happened and then the price moved lower further as I expected it to and delivered a wonderful move to downside!

On the M15 chart, the market provided us with various facts supporting the bearish view. The price which was moving higher created a bearish divergence between the first high that has formed at 194.017 and the second high that has formed at 194.223 based on the MACD indicator, which we may consider as evidence of bearish pressure. The price then moved lower and broke below the most recent uptrend line. We may consider these as facts provided by the market supporting the bearish view and also there were no signs opposing this bearish view. Then as you can see in the image below how the price moved lower further and provided a wonderful move to the downside.
As traders we always have two choices, the first one is to fall in love with our analysis and try to convince the market and expect the price to move in the direction as per our wish. The second one is to follow the facts that the market provides us and make the right actions according to that. As you know the first option won’t help us and as you can see in the example above what happened when we followed the facts that the market hinted to us and took the right action according to that.
For similar trade ideas and much more I invite you to
Also, you can get one of our strategies free of charge. You will find all the details here
Download our best forex indicators here
If you have any further questions, don’t hesitate to drop a comment below!
Happy Trading!
Arvinth Akash
Home Trader Club Team.


