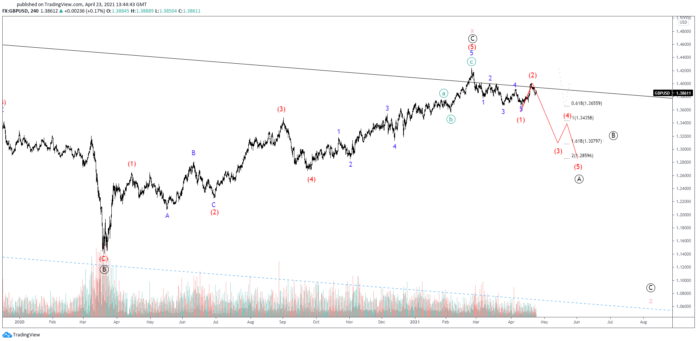
GBPUSD cycle degree structure suggests that the recent top at 1.4245 completed wave Ⓒ of a running flat. The 5-wave bullish move seen in the red intermediate degree is part of the longer-term triple three pattern, labelled wxyxz.
Despite wave Ⓒending the flat pattern a tad higher than the often-seen retracement levels, the rules are respected as the intermediate wave structure ended below the start of wave Ⓐ.
Ending Diagonal Pattern Suggest Completion of Impulse
With the ending diagonal in (5) somewhat confirming the end of the upside, prices can be expected to continue to move lower. In addition, where the flat ended, lays the top descending trendline of the long-term channel starting back in 2008.
It’ll be interesting to see whether the leading diagonal completed on the first bearish leg following the recent top is to continue in an impulsive (3). In such scenario, prices could start moving down towards the 1.3079, and 1.2859. There waves (3) and (5) of the primary degree correction in wave z could end.
Without a break of the previous low in minor 5, the probabilities of moving higher would increase.
Upside Likely to Validate Expanding Flat OR Both Flats
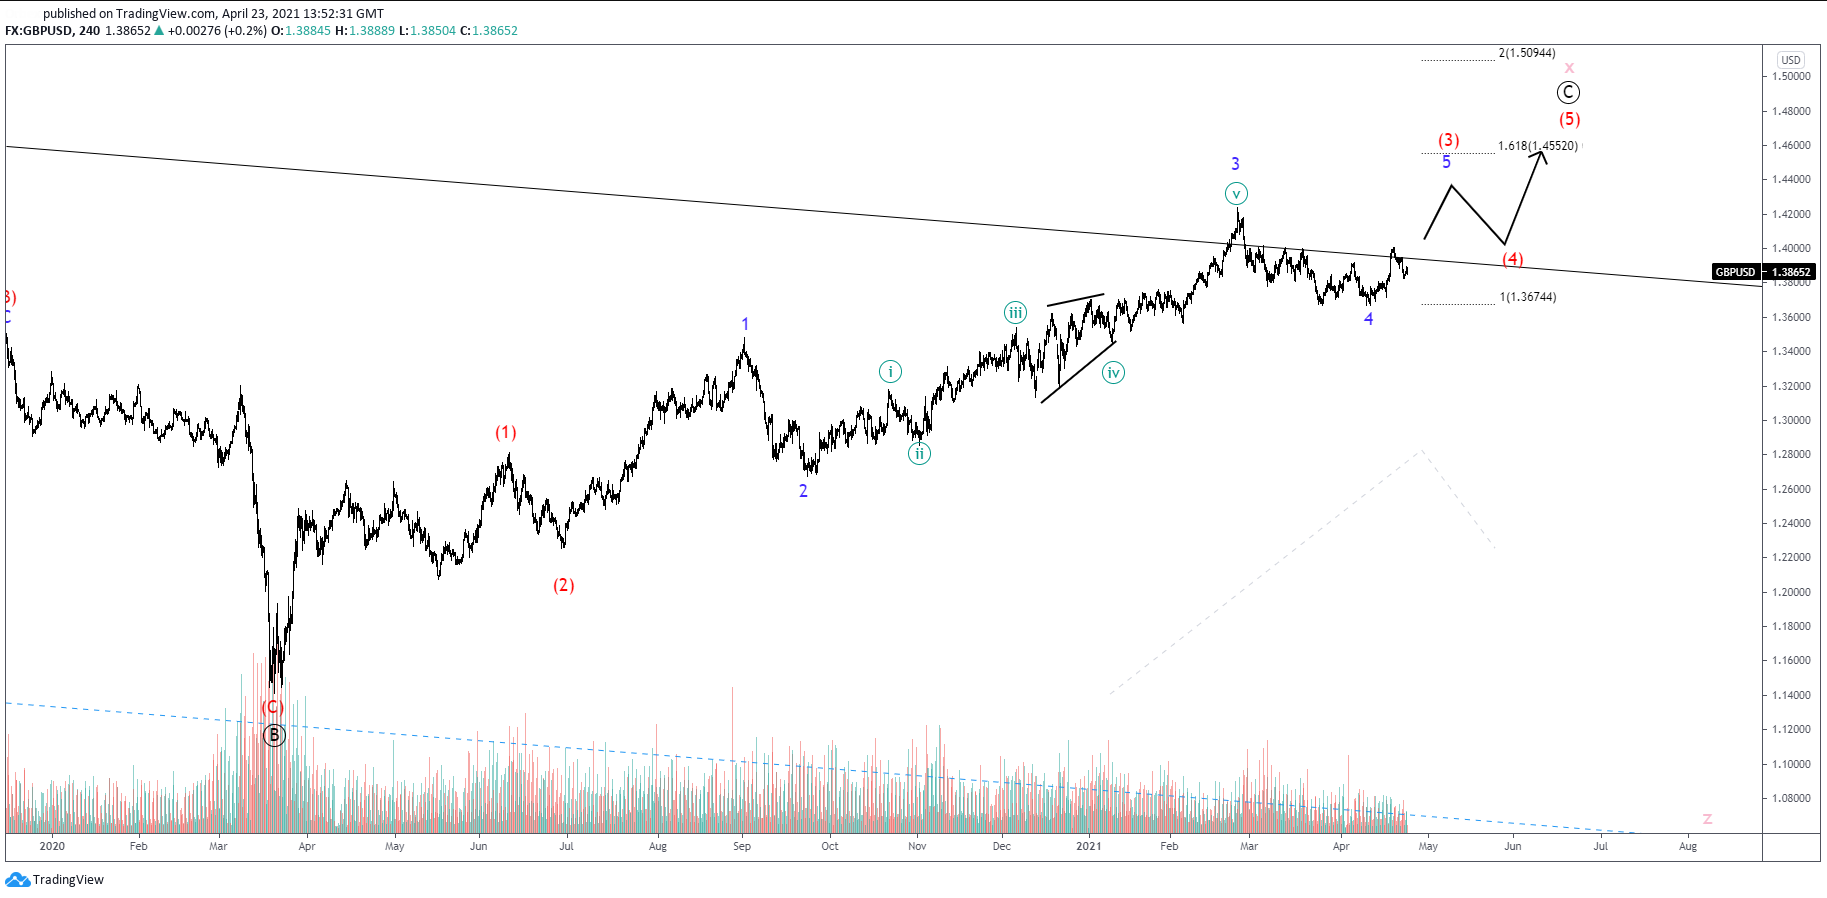 Should prices continue higher and back above the channel’s trendline, the alleged leading diagonal in (1) could alternatively be seen as a correction in minor wave 4.
In that case wave Ⓐ’s top at 1.4390 will come under risk of breaking.
If it does, then the pattern will likely turn into an expanding flat, and run for the 161.80% Fibonacci at 1.5941, or anywhere between there and the former breakout level. Prices would have to break above the 1.4552 first, then 1.5094 to get near there first though.
If it doesn’t, then we’d have to still treat the pattern as a running flat.
However, trades should be worrisome of a break above 1.4552 in general as the probabilities of having ended the triple three at 1.14 would increase.
About the Author
 Stavros is an licensed Forex professional, currently heading the investment research team at a reputable broker. He has demonstrated history in proprietary trading, Elliott Wave analysis and educational content writing. He is seen writing in the best sites for traders.
You can follow Stavros on Twitter and Linkedin here: twitter.com/StavrosTousios & linkedin.com/in/stavrostousios/

