


Hi Traders! NZDUSD forecast and technical analysis is here. The way I would like to analyze the chart for setups is based on multi-timeframe confirmations because in my POV if we get more evidences on different timeframes for the same direction then it makes the setup much more reliable. If you would like to learn more about the way we trade and the technical analysis we use then check out the Traders Academy Club Spoiler alert – free memberships are available! Let’s start our analysis from the highest timeframe which will be the daily chart here.
You can watch the video explanation of this idea here
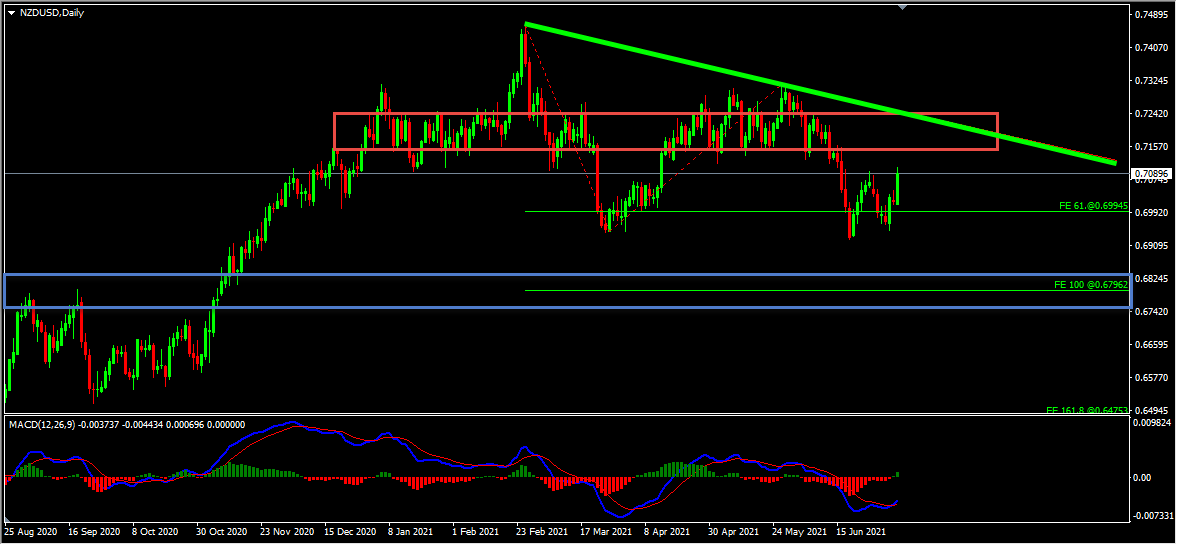
NZDUSD D1(Daily) Chart Analysis – Strong Resistance Zone, Key Support Zone, Downtrend Line
On the daily chart the price which is moving lower has broken below a strong support zone and is holding below it, we may consider this as evidence of bearish pressure. Currently it looks like a correction is happening and this strong support zone is acting as a strong resistance zone for us. Also while measuring the first wave using the Fibonacci expansion tool we could see that the 100%(0.67962) Fibonacci expansion level coincides with a strong support zone which makes this area a key support zone for us. We could see that the price still has room lower towards this key support zone. So based on all this my view here is bearish and until the downtrend line holds, I expect the price to move lower towards the key support zone. We may now move down to lower timeframe and look for evidences supporting this bearish view.
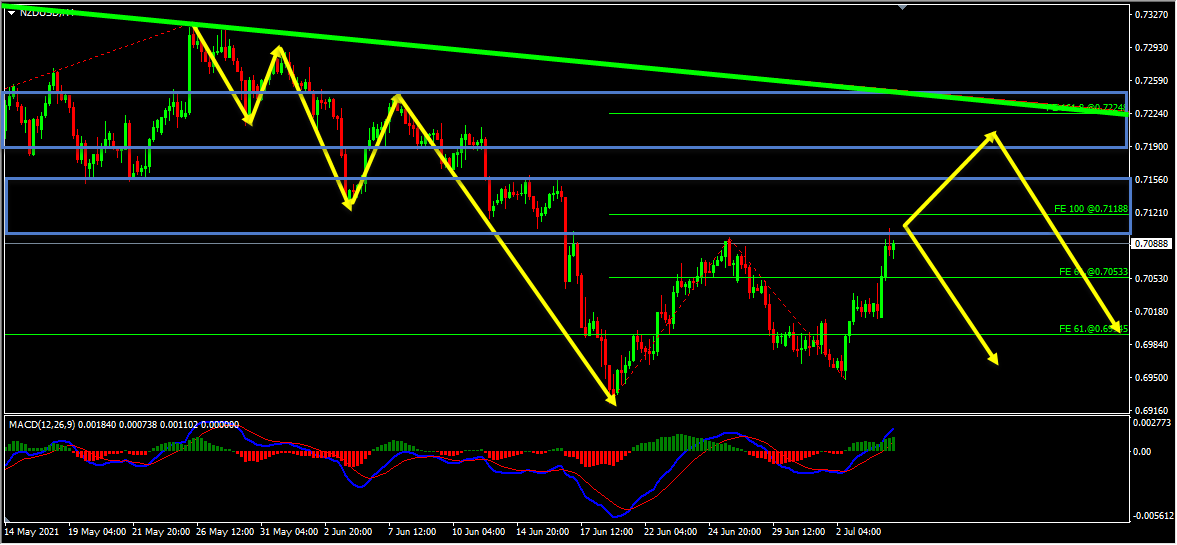
NZDUSD H4(4 Hours) Chart Analysis – Bearish Trend Pattern, Two Key Resistance Zones
On the H4 chart the price which was moving lower has created a bearish trend pattern in the form of three lower highs, lower lows which we may consider as evidence of bearish pressure. Generally, after a bearish trend pattern, we may expect corrections and then further continuation lower. Currently it looks like a correction is happening. Also, while measuring the first wave of this correction using the Fibonacci expansion tool, we could see that the 100%(0.71188) Fibonacci expansion level of this first wave coincides with a strong resistance zone which makes this a key resistance zone for us. Also, we could see that the 161.8%(0.72248) Fibonacci expansion level of this first wave and the daily downtrend line coincides with the second resistance zone which makes this area a second key resistance zone for us. Until both these key resistance zones hold my view remains bearish here and I expect the price to move lower further.
Technical Analysis & Forecast Summary
NZDUSD D1(Daily) Chart Analysis
- Strong Resistance Zone, Key Support Zone, Downtrend Line
NZDUSD H4(4 Hours) Chart Analysis
- Bearish Trend Pattern, Two Key Resistance Zones
Trading Tips
It is always recommended to look for confirmations before you jump into any trade. If you are not sure about how to trade this sell setup then you can use any setup and strategy that you have in your arsenal to look for bearish moves and join this sell trade.
Also don’t forget to protect your sell trade using a stop loss and make sure to set a target and keep a proper risk/reward ratio.
You will also find a pretty extensive database of educational materials here in the blog – just use the search or check out the Forex Education section above.
Not sure how to enter a trade? Spot reversals (bounces)? Not sure how to spot breakouts?
I invite you to
Also, you can get one of our strategies free of charge. You will find all the details here
If you have any further questions, don’t hesitate to drop a comment below!
To your success,
Vladimir Ribakov
Certified Financial Technician


