In the near-term there is still a risk that the WTI (Crude Oil) rally can falter. This flags additional scope for further upside but points at a structurally weaker price once the top is in.
My Elliott wave analyses outlines the crossroads crude oil finds itself at.
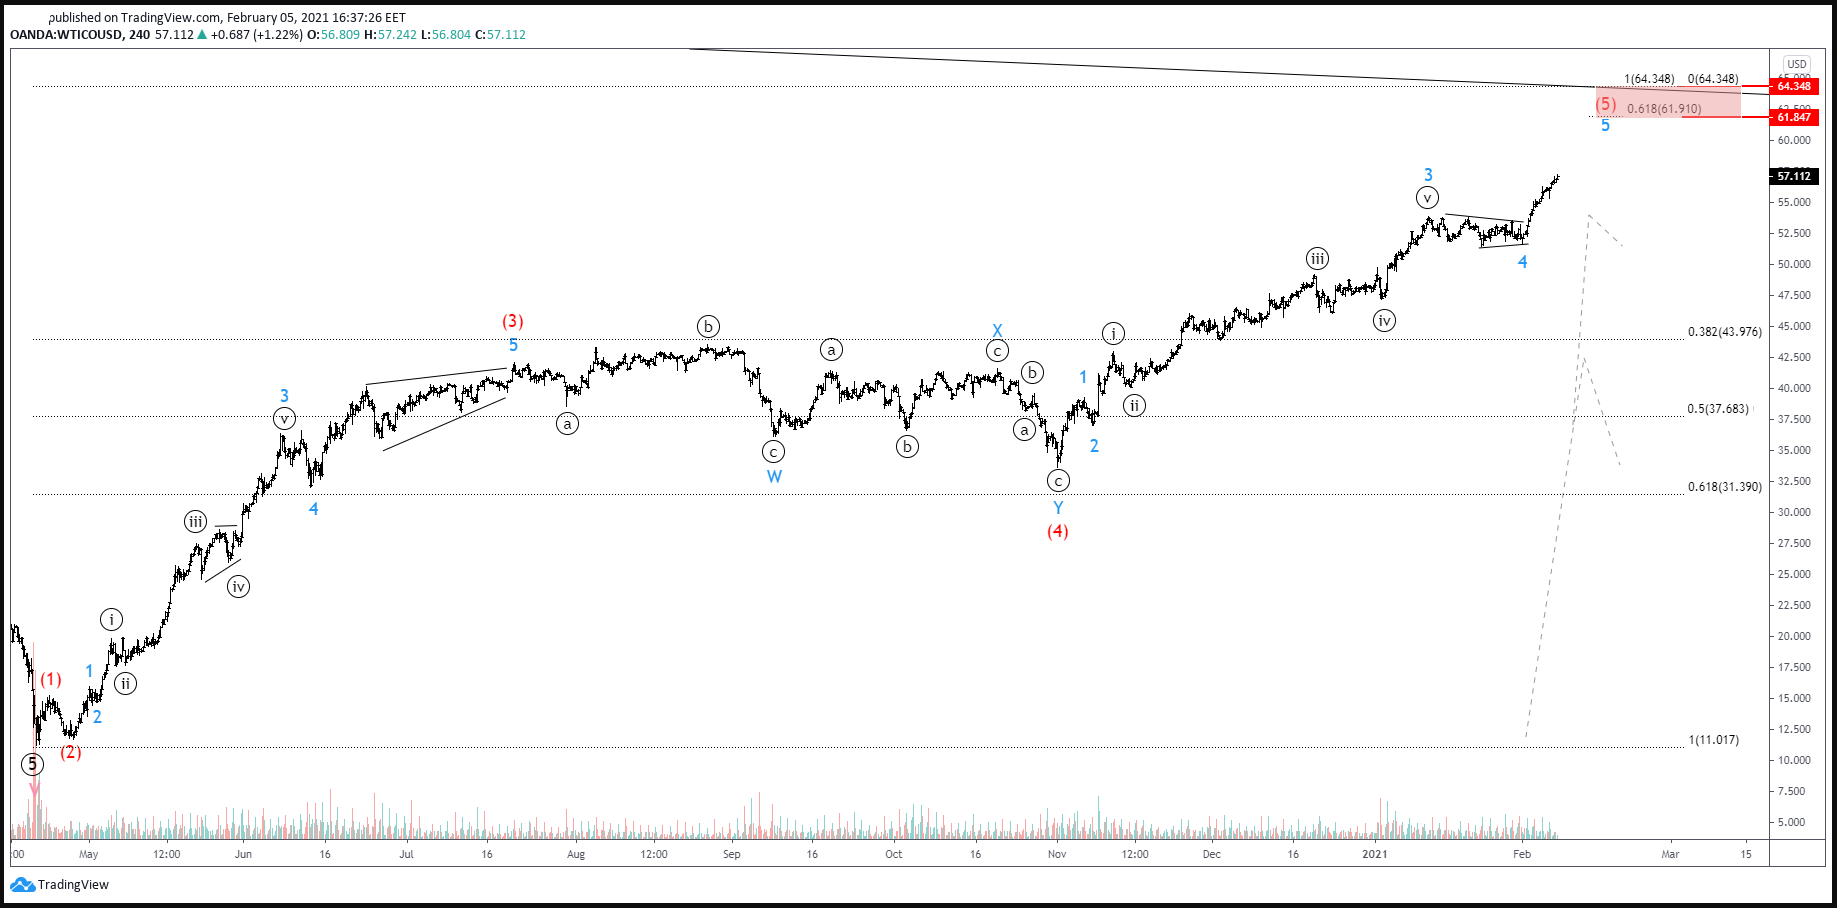
In the short-term, the recent breakout of the running triangle in blue 4 is indicative of bullish rather than bearish dynamics. This may create additional pressure on the upside over the short-run, however, it hints at a subsequent downtrend in prices that may offer a pullback in the medium and perhaps even the long-term.
Crude Oil Targets Higher
In order to project where the prices of oil may register a top we need to apply the Fibonacci extension tool at several points since this is a mutli-degree rally from the lows of $11. The first longer-term projection delivers a $64.34 top, whereas the second and shorter-term projection sees an end to the trend at the $61.91.
The extension of red waves (3) and (4) suggests that prices may extend up to 100% of red (3). According to Elliott waves, this is known as the guideline of equality. The guideline of equality says that any of the two waves in a 5-wave impulse tend towards equality. These two waves in our case our waves (3) and (5) as red (1) is very short.
On the other hand, we have the usual 61.80% Fibonacci extension we need to take into account for the shorter-term projection. This extension of blue waves 3 and 4 suggests that prices may extend up to 61.80% of blue 3.
Where Do Bears Get In?
What is interesting to mention is that the 100% extension at $64.34 forms a cluster with the descending trendline of the cycle degree ending diagonal completing its course at $11. Near there, it is unlikely to receive insignificant bearish pressure whether this turns to a short-term pullback or a dip. But before that, we need to worry about another count.
What Are the Chances of an Early Crop?
Pretty good chances if I may add.
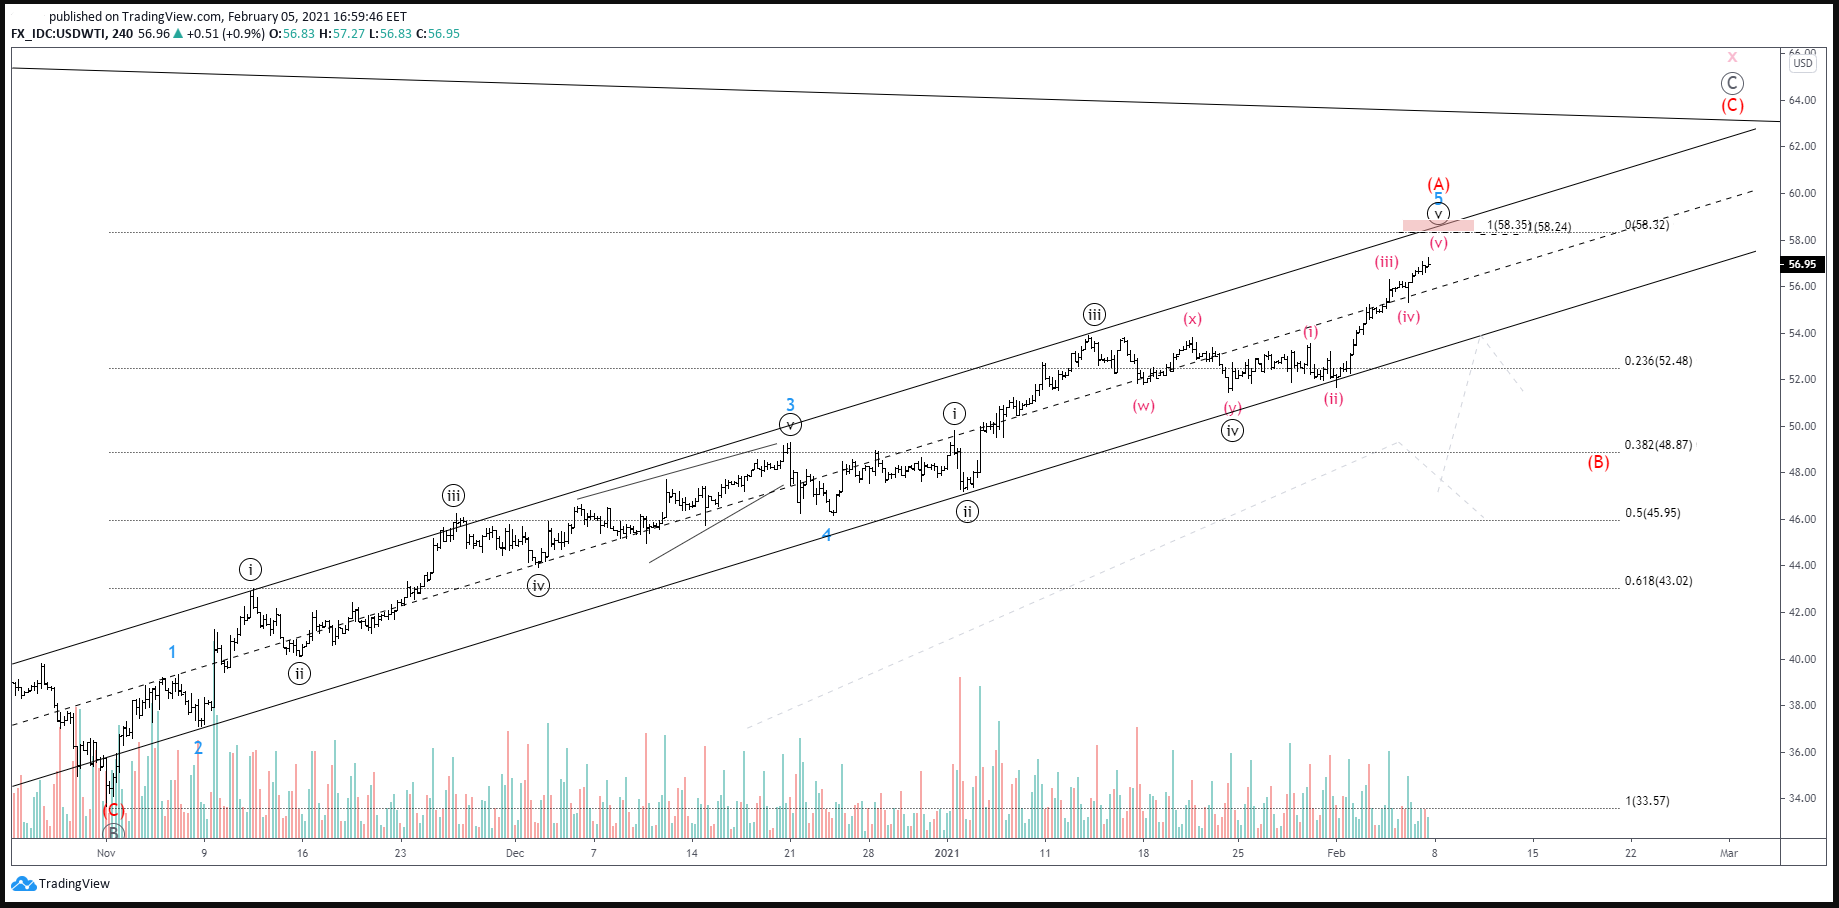
The above chart suggests that the prices of oil have been moving up from the lows of $11 as part of a bullish correction in grey Ⓒ, rather than an impulse. The medium-term low of $33.57 is still seen as a 5-wave impulse, however, the count in blue 3 is different, ending at $49.31 and not at $53.89. In addition, the said level produces a cluster with the 100% extension of encircled black ⅲ.
In such scenario, prices extend only up to $58.35 while still respecting the guideline of equality. This suggests that crude oil may slide lower sooner than what the first count indicates with first target the $52.48, and second the $48.88 support.
About the Author
Stavros is an licensed Forex professional, currently heading the investment research team at a reputable broker. He has demonstrated history in proprietary trading, Elliott Wave analysis and educational content writing. He is seen writing in the best sites for traders.
You can follow Stavros on Twitter and Linkedin here: https://twitter.com/StavrosTousios & https://www.linkedin.com/in/stavrostousios/

